
The Evolution of Digital Network Operations and Monitoring Challenges
Against the backdrop of high-density endpoint access and converged multi-service deployment in enterprise campus networks, the standard for network infrastructure operations has shifted from "basic connectivity" to "business-level, fine-grained observability." However, traditional SNMP polling mechanisms are facing serious challenges in modern architectures: low collection frequency, coarse data granularity, and — under large-scale concurrent requests — frequent MIB-tree traversal that causes switch CPU load to spike sharply.
AsterNOS is deeply integrated with SONiC's standard monitoring architecture. Using direct, local in-memory database connectivity, it converts underlying hardware status, port traffic, PoE power delivery, IP SLA link quality, and PTP metrics directly into standard, Prometheus-recognizable time-series data — providing the underlying foundation for building lightweight, efficient campus automated operations and closed-loop, self-healing scenarios.
Architecture and Core Mechanisms of the SONiC Exporter
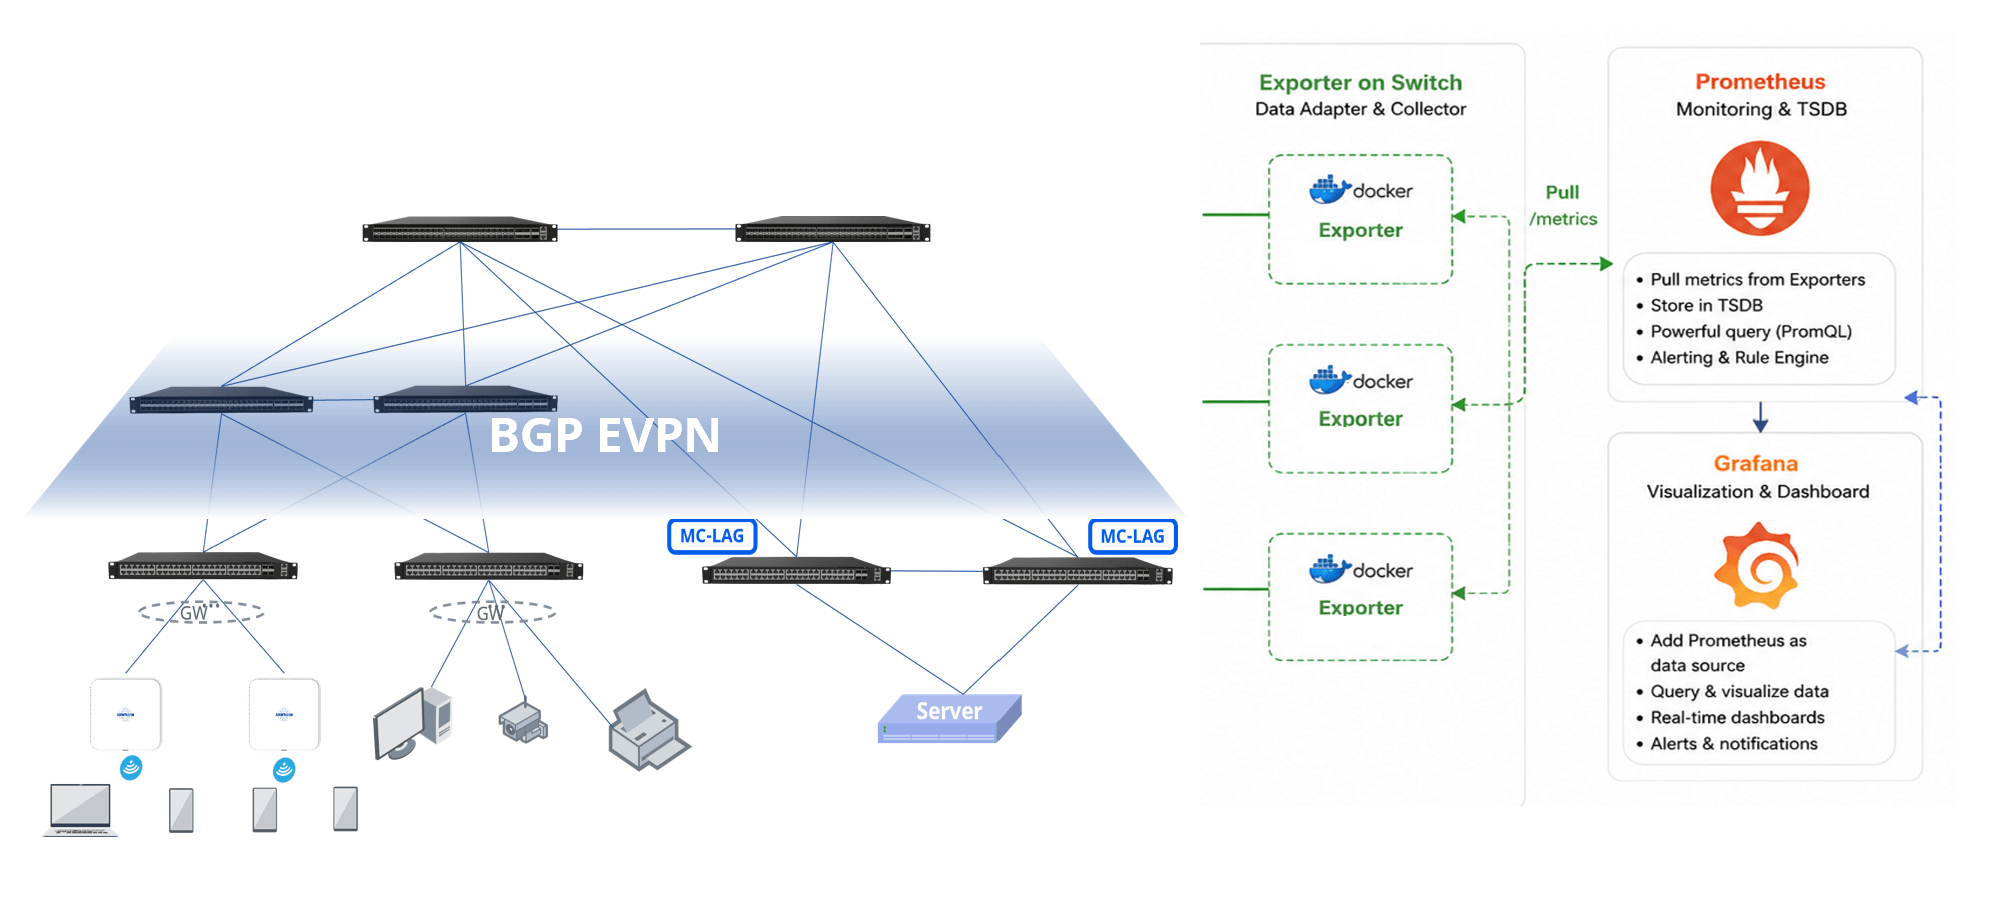
Data Presentation Architecture
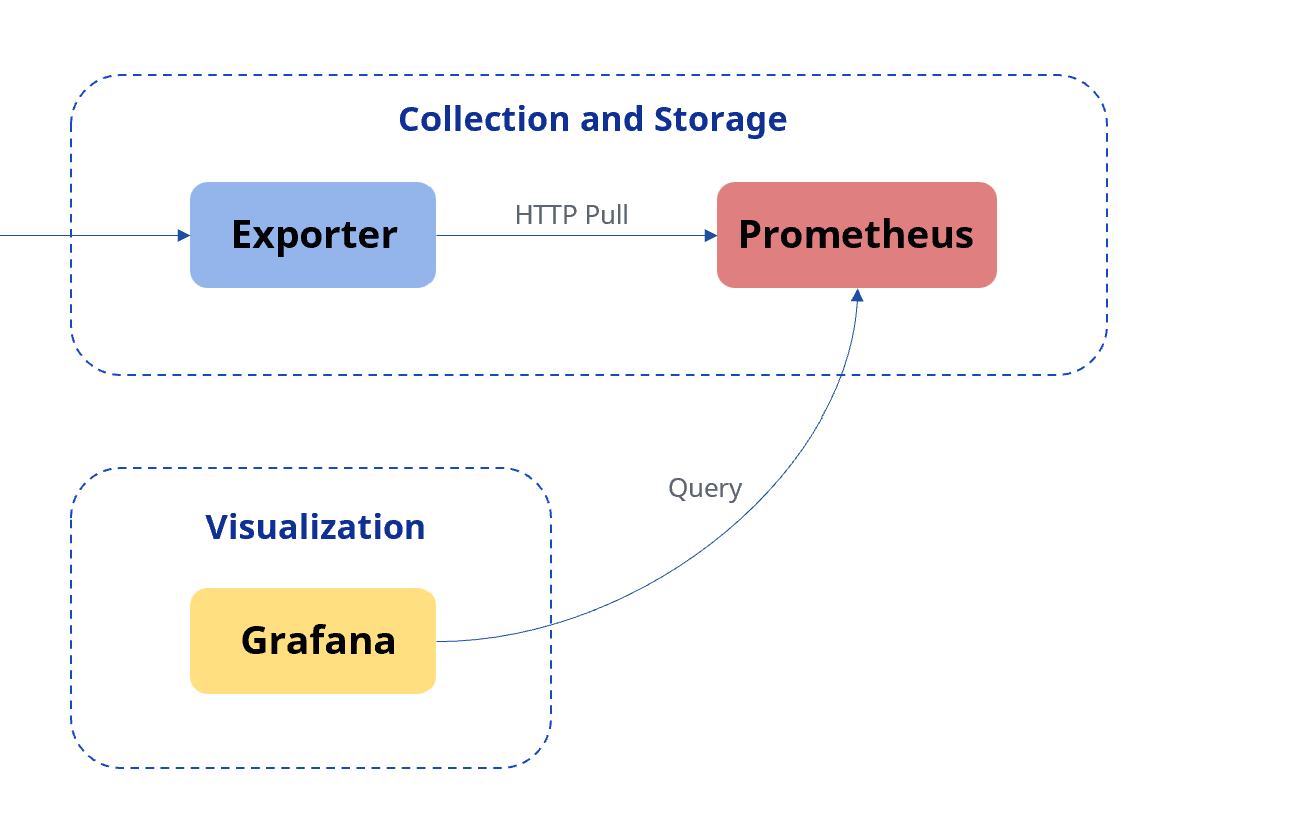
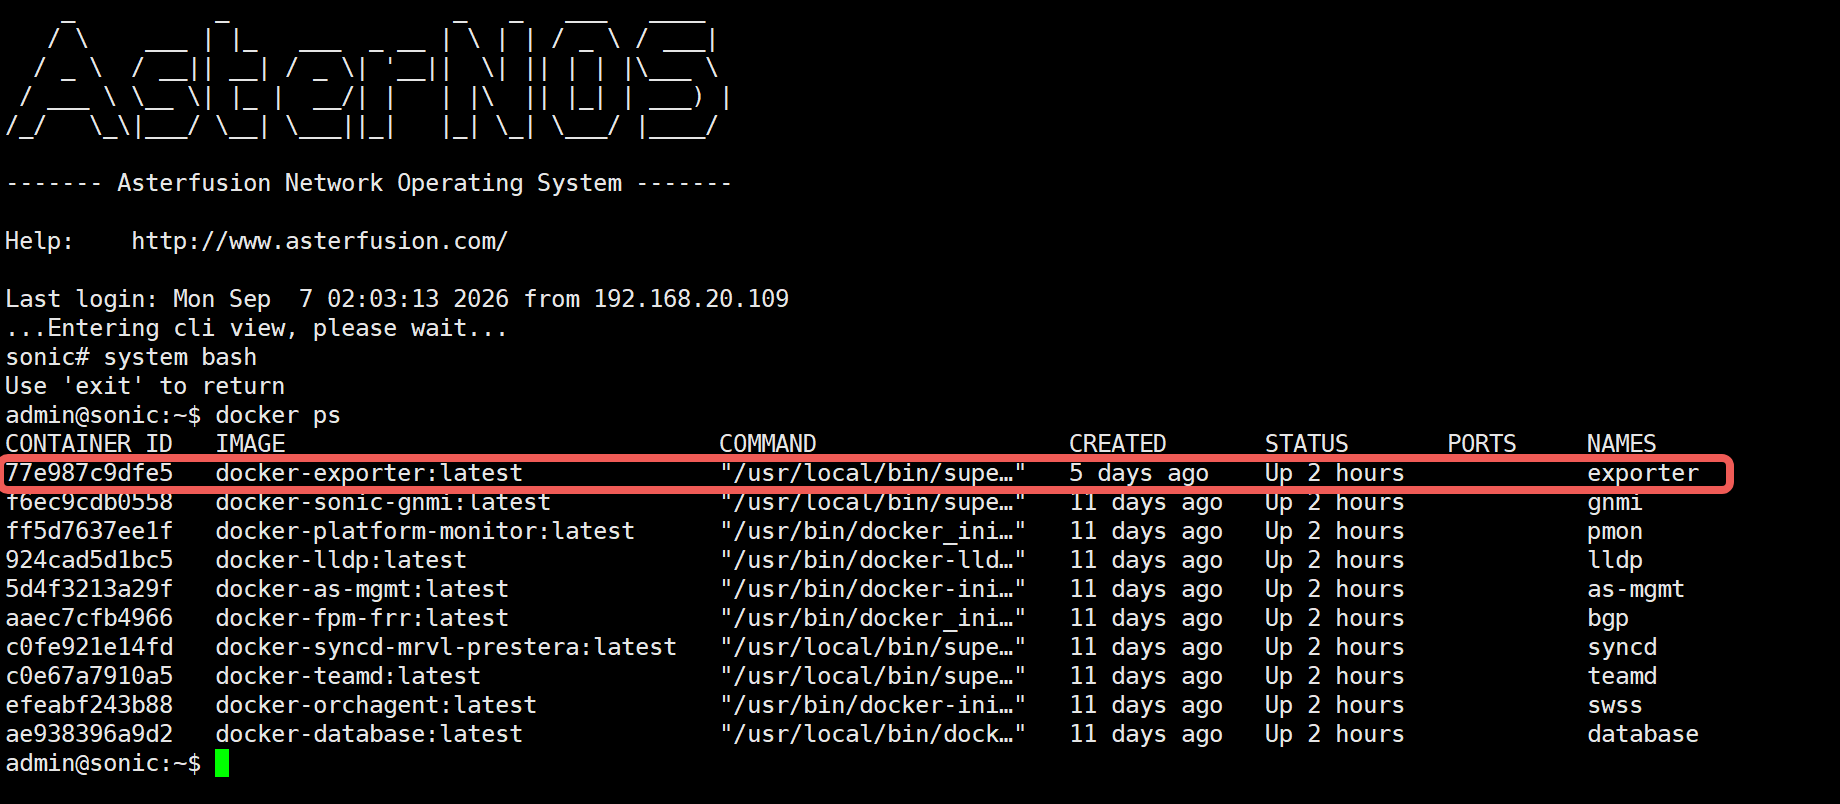
Exporter: The "dedicated data adapter" for AsterNOS switches, responsible for data collection. It converts the various metrics from different monitored targets into a standard data format that Prometheus can understand. The Exporter runs as an independent Docker container on the device being monitored and exposes an HTTP endpoint (http://localhost:9100/metrics). Prometheus periodically "scrapes" data from this endpoint.
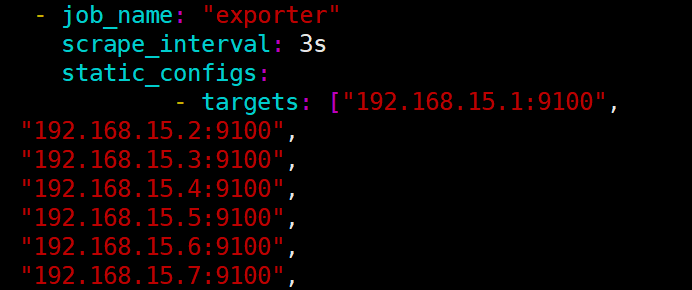
Prometheus: The "data center" and "brain" of the entire monitoring system, responsible for pulling and storing data. It actively and periodically pulls data from each Exporter's endpoint, then stores it in its built-in time-series database (TSDB) for efficient management. Simply specify the Exporter's address in Prometheus's configuration file, and it will automatically begin collecting and storing this time-series data.
Grafana: The final "presentation window" for the data, responsible for displaying and visualizing it. It renders the massive volumes of data stored in Prometheus as clean, intuitive charts and tables. Grafana itself stores no data — it is purely a query-and-display interface. Prometheus can be added to it as a data source, and PromQL queries can then turn the relevant data into real-time, interactive dashboards.
Core Mechanism
Unlike traditional monitoring, which relies on protocol-stack conversion, the Exporter uses direct, local in-memory database connectivity, bypassing complex protocol translation entirely.
Traditional switch monitoring (e.g., collection via SNMP or an external MIB) requires wrapping data in complex protocol layers. The AsterNOS Exporter, by contrast, takes full advantage of SONiC's database-centric architecture, connecting directly to the switch's local in-memory database to achieve extremely fast data collection.
Local loopback connection (Go-Redis Client): The Exporter runs as an independent Docker container on the switch. It establishes a connection to the local Redis in-memory database over
127.0.0.1:6379.Direct pass-through across multiple database instances: As internal switch components run, they continuously write their real-time state into different Redis database instances. When the Exporter receives a Pull request from Prometheus, it routes the query directly to the corresponding local database:
STATEDB: Reads running-protocol and hardware operational state.
COUNTERSDB: Reads high-frequency-changing interface packet counters.
CONFIGDB: Reads device configuration information.
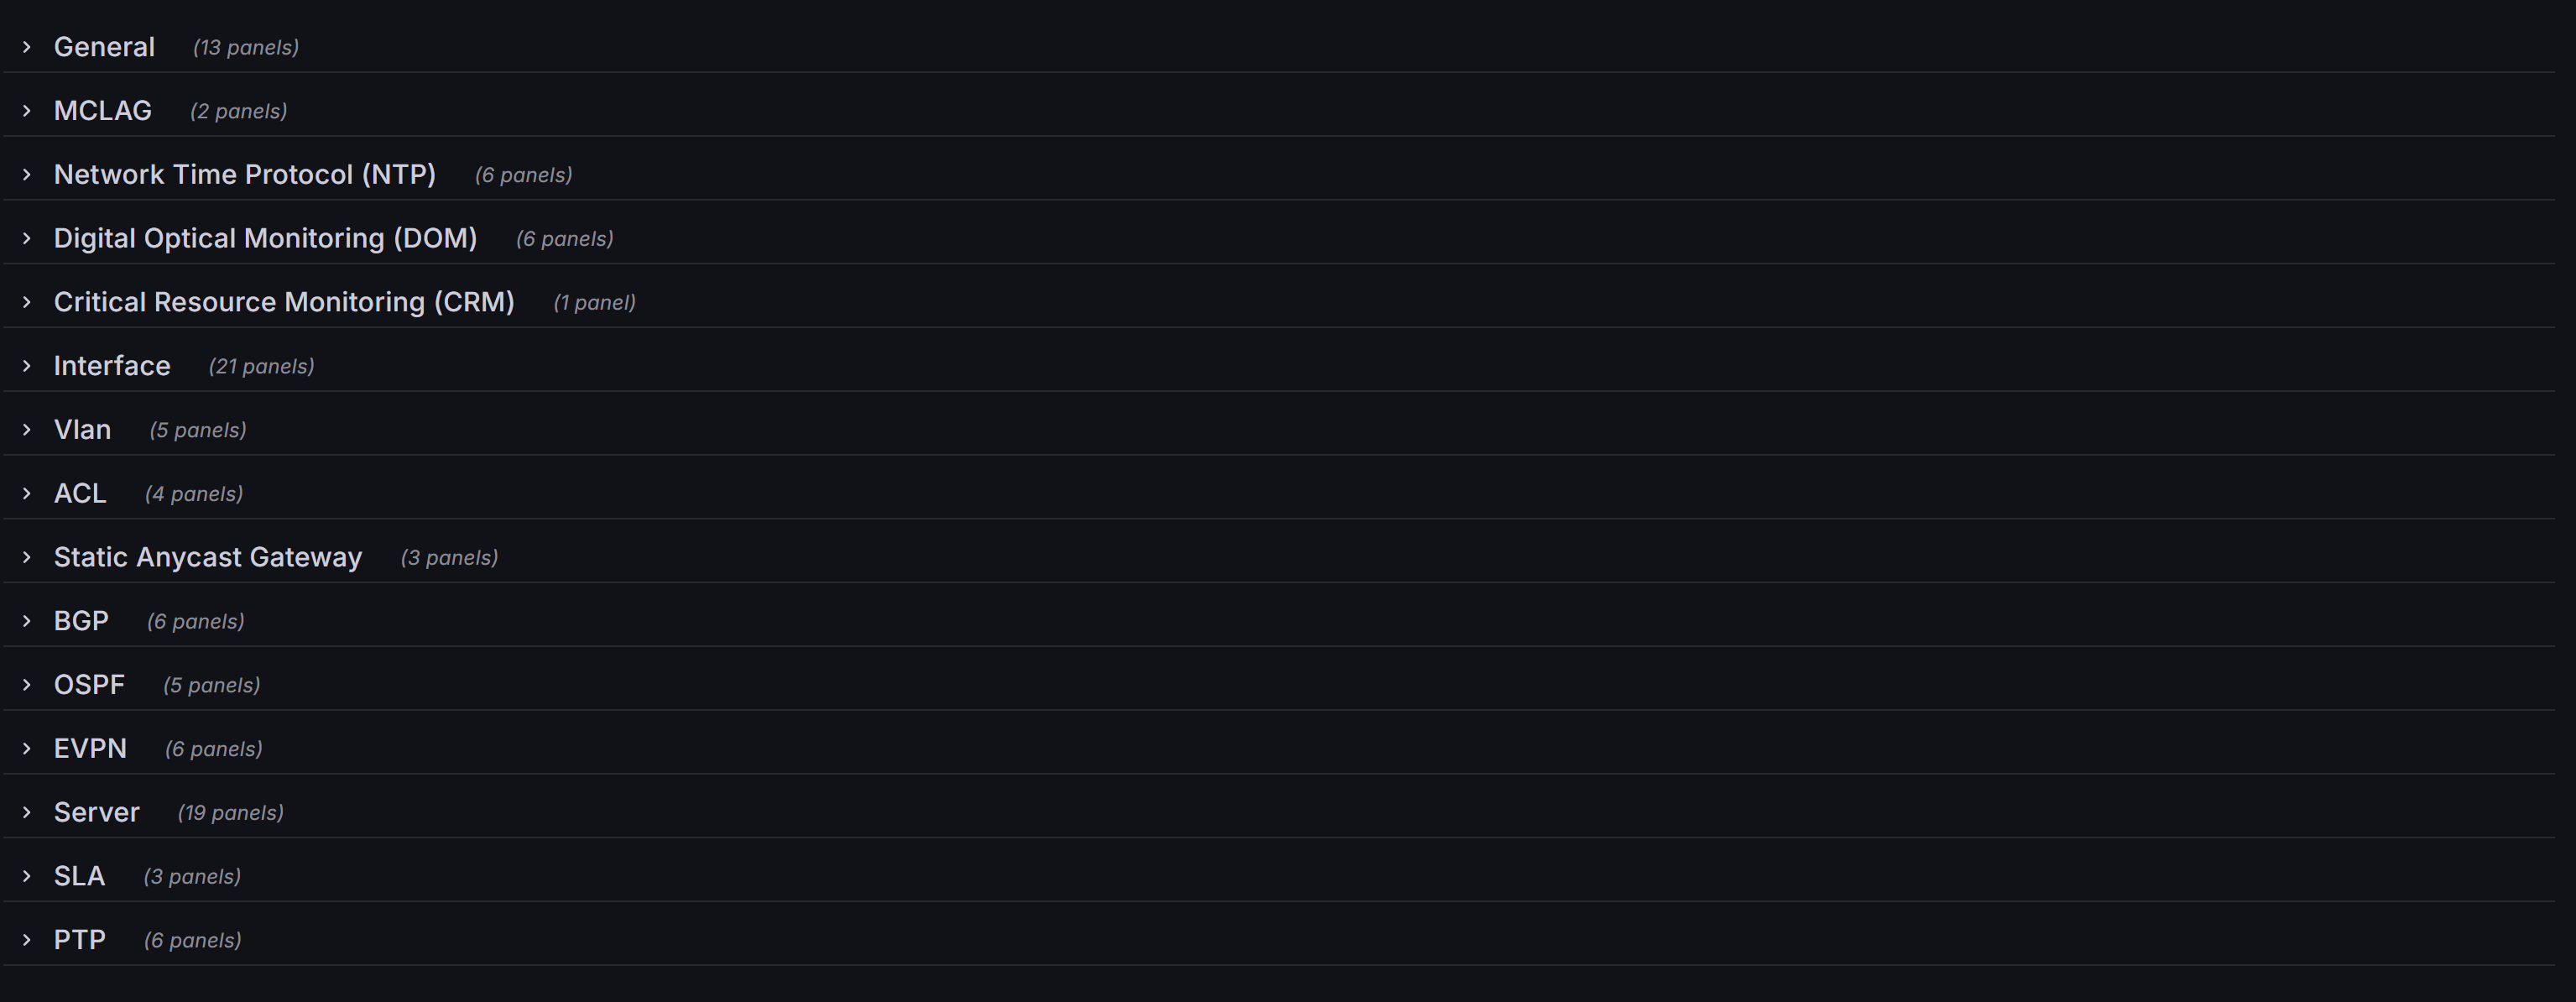
Monitoring Capability Matrix
Module | Metrics Collected |
|---|---|
General | Device Up Time |
Memory Usage | |
Device Info | |
CPU Usage | |
FAN RPM | |
Sensor's Temp | |
Sensor's Temp Threshold | |
PSU Input Current | |
PSU Output Current | |
PSU Input Volts | |
PSU Output Volts | |
PSU Input Power | |
PSU Output Power | |
MCLAG | MCLAG Domain Operational Status |
MCLAG State Info | |
Network Time Protocol (NTP) | NTP Sync Status |
NTP Jitter — mean deviation in time between the switch and the NTP server | |
Round-trip delay to the NTP server | |
NTP Global | |
NTP Offset — time difference between the switch and the NTP server | |
Time since last synchronized | |
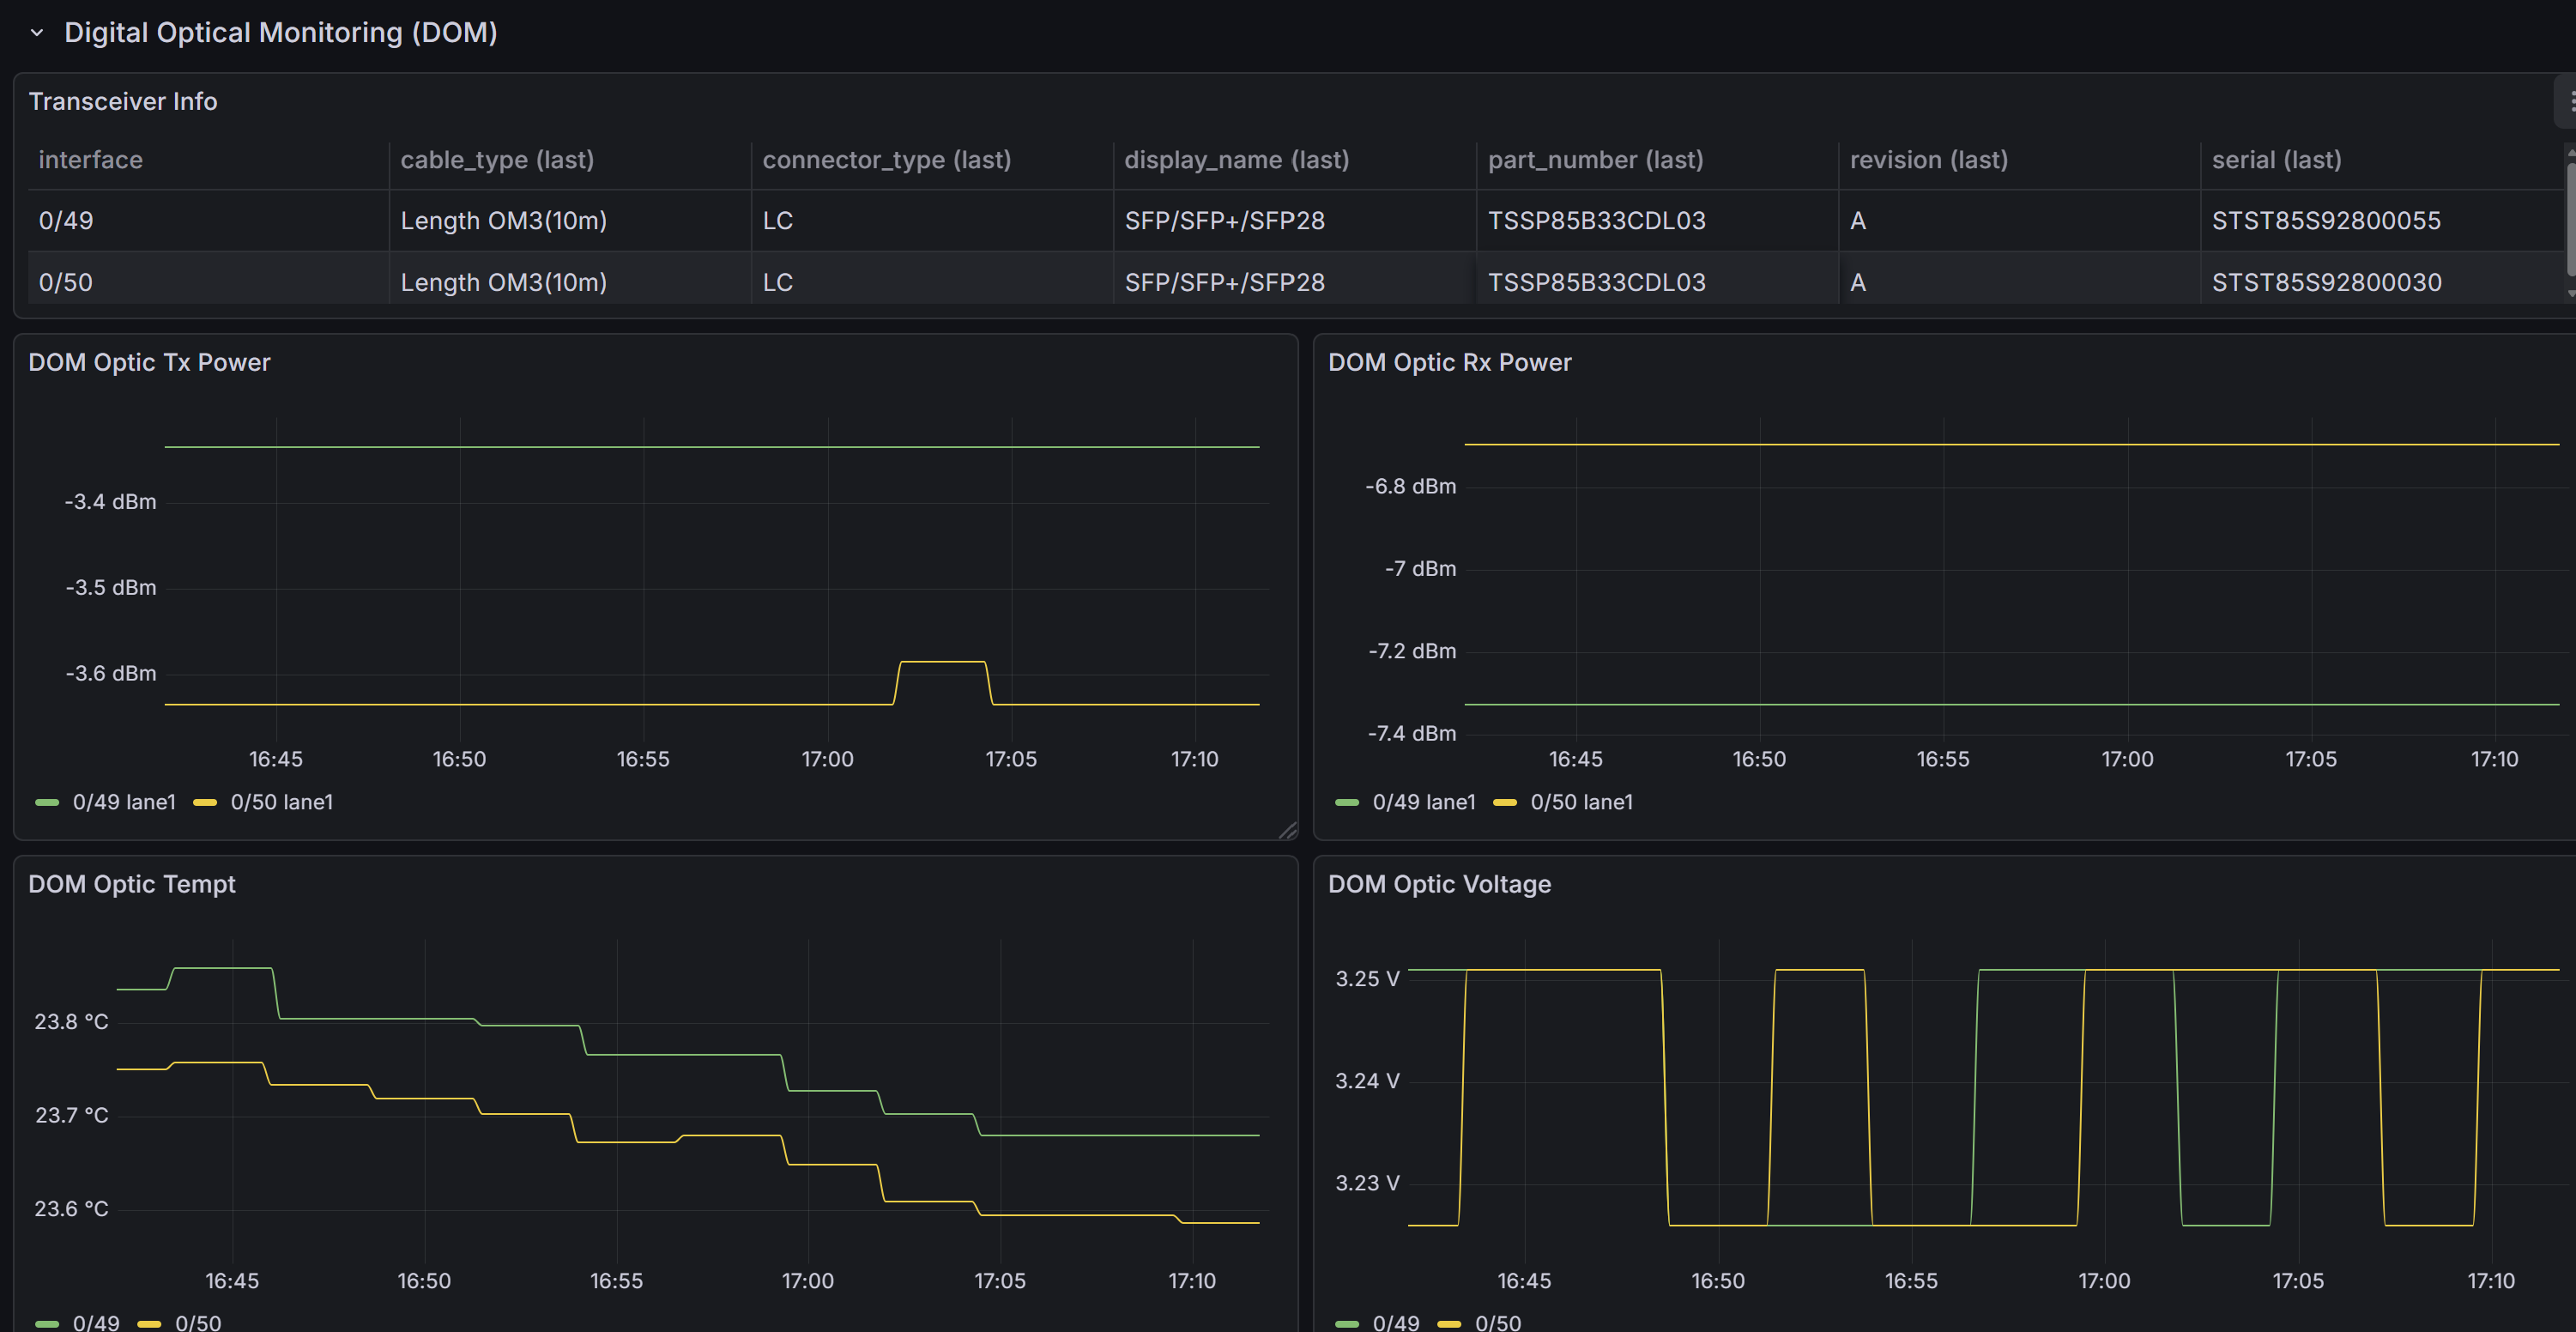
Digital Optical Monitoring (DOM) | Transceiver Info |
DOM Optic Tx Power | |
DOM Optic Rx Power | |
DOM Optic Temp | |
DOM Optic Voltage | |
DOM Bias Ampere | |
Critical Resource Monitoring (CRM) | CRM Stats |
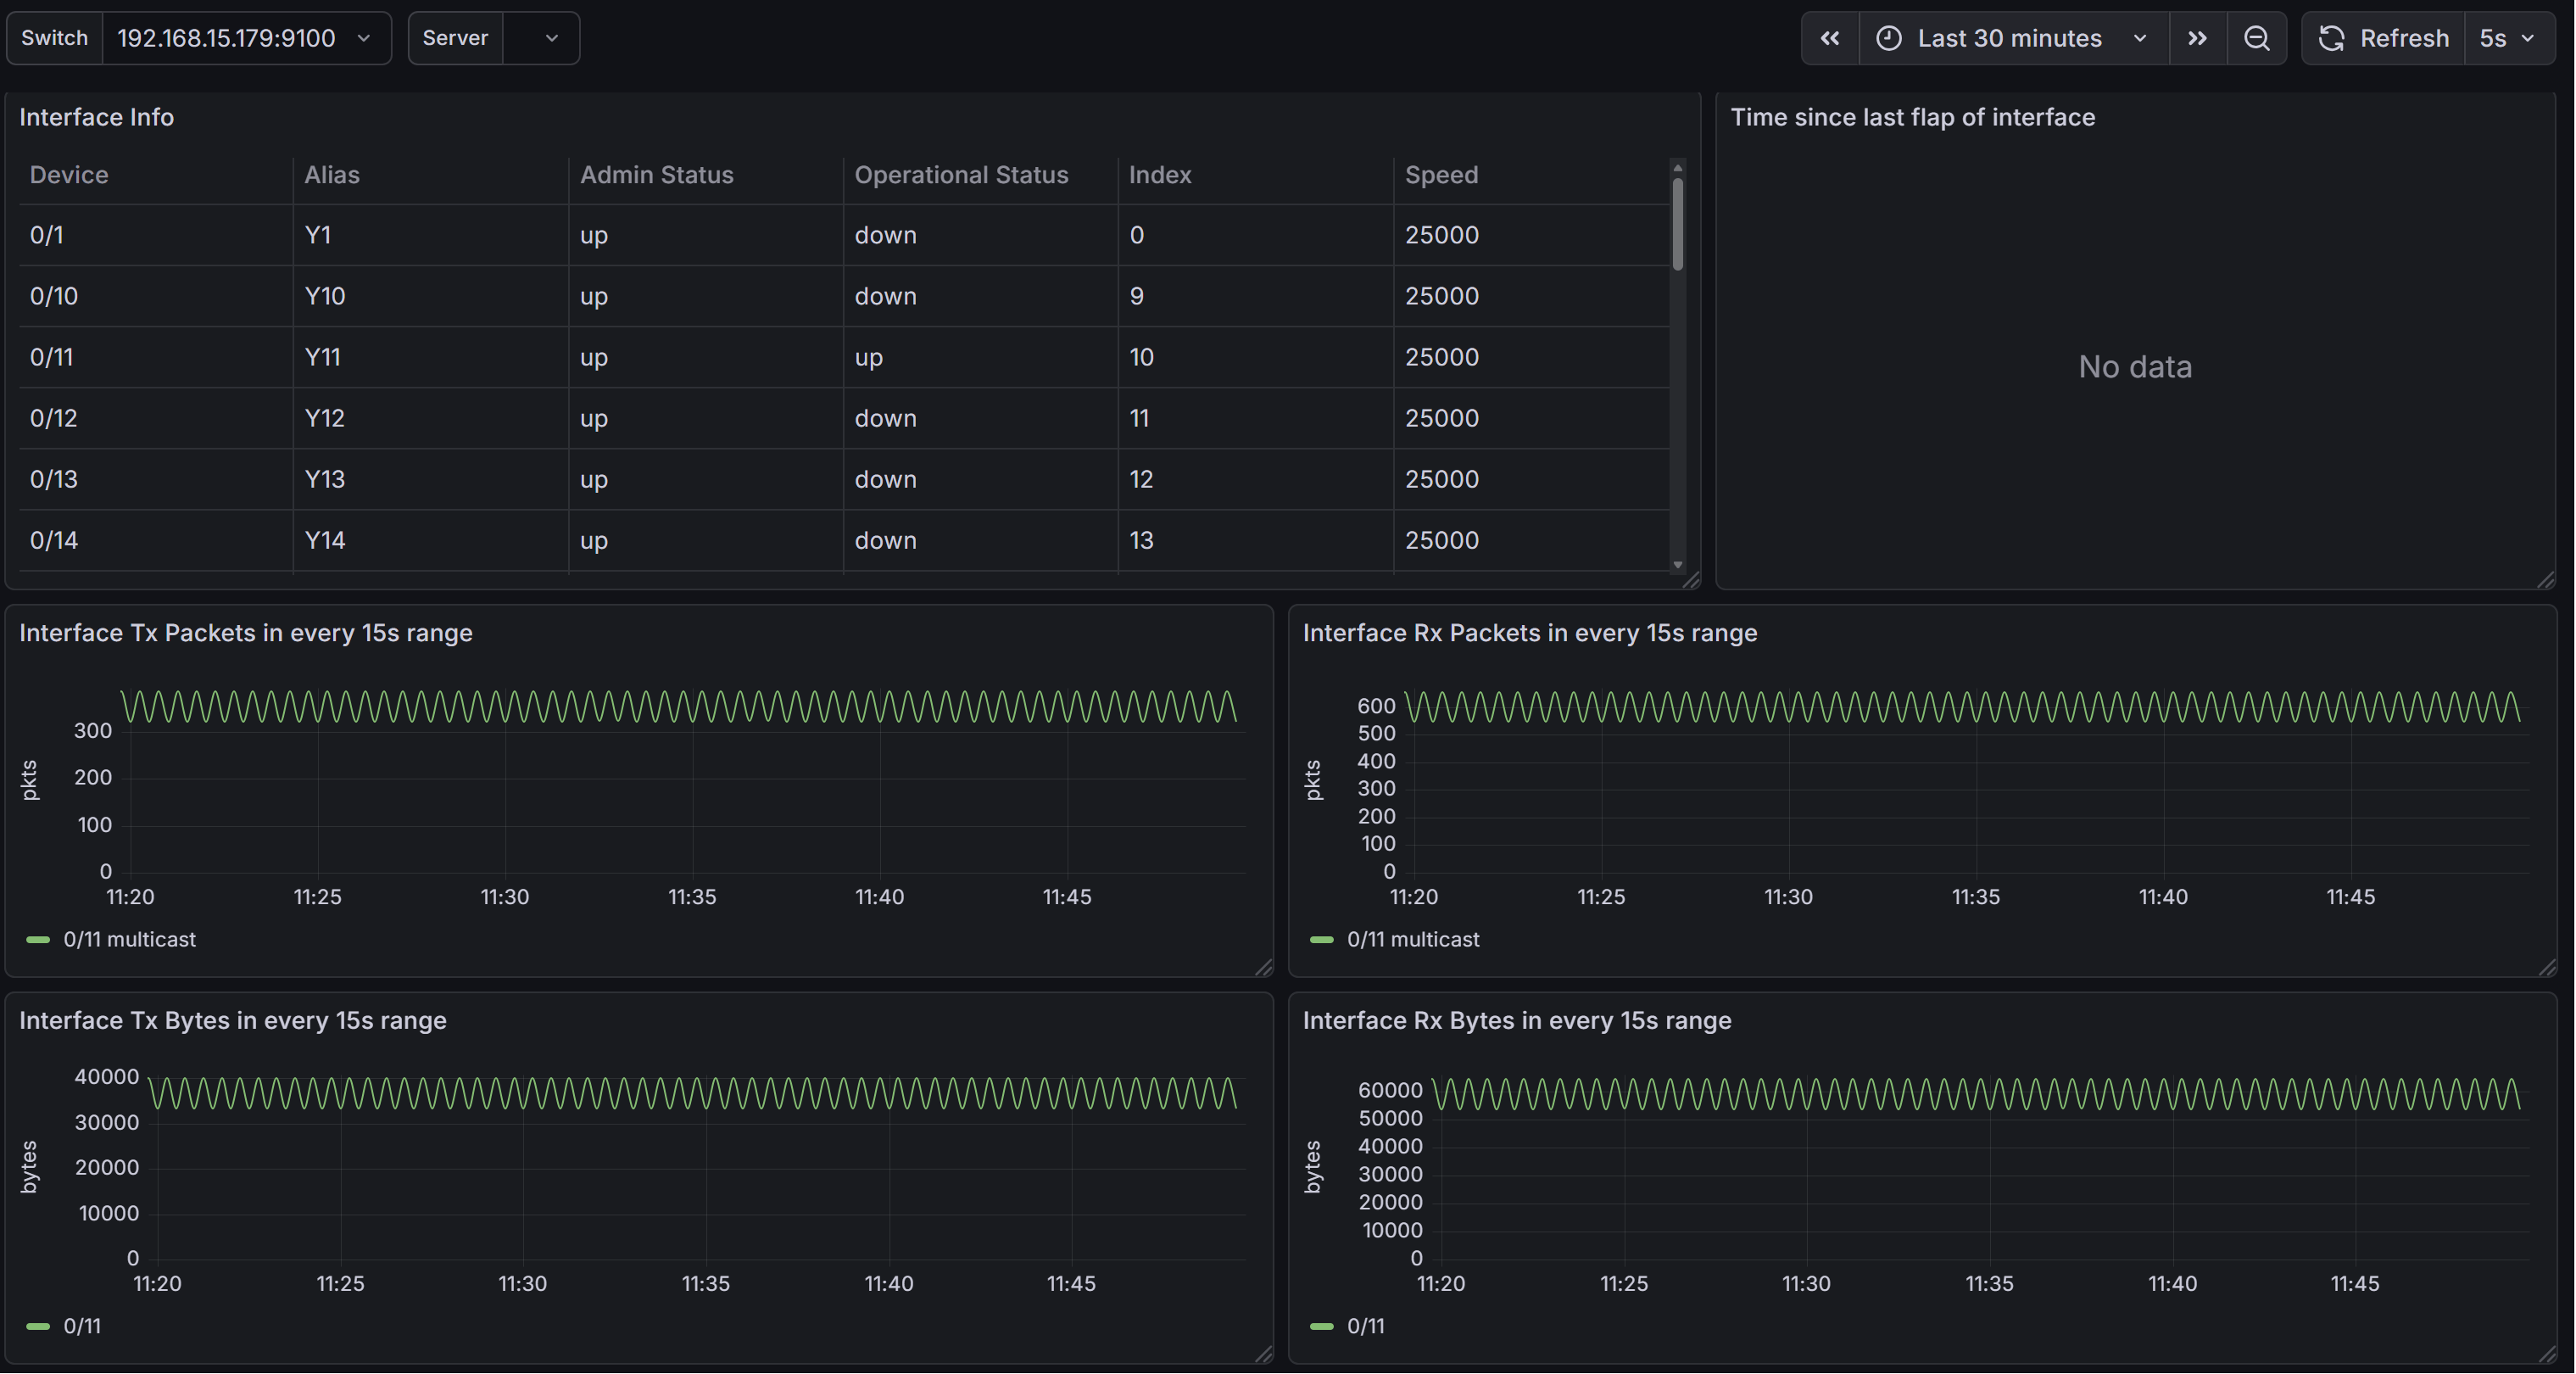
Interface | Interface Info |
Time since last flap of interface | |
Interface Tx Packets | |
Interface Rx Packets | |
Interface Tx Bytes | |
Interface Rx Bytes | |
Interface Tx Buffer Drop Packets | |
Interface Rx Buffer Drop Packets | |
Interface Tx Drop Packets | |
Interface Rx Drop Packets | |
Interface Tx Error Packets | |
Interface Rx Error Packets | |
Packets Received on Ethernet | |
Size of Ethernet Frames Transmitted | |
Interface Queue Transmitted Packets | |
Interface Queue Transmitted Bytes | |
Interface Egress Queue Dropped Packets | |
Interface Egress Queue Dropped Bytes | |
Interface PoE Current (Amps) | |
Interface PoE Voltage (Volts) | |
PoE Power (Watts) | |
VLAN | VLAN Tx Packets |
VLAN Rx Packets | |
VLAN Tx Bytes | |
VLAN Rx Bytes | |
VLAN Information | |
ACL | ACL Table Info |
ACL Rule Info | |
ACL Packets | |
ACL Bytes | |
Static Anycast Gateway | SAG Info |
SAG Admin Status | |
SAG Operational Status | |
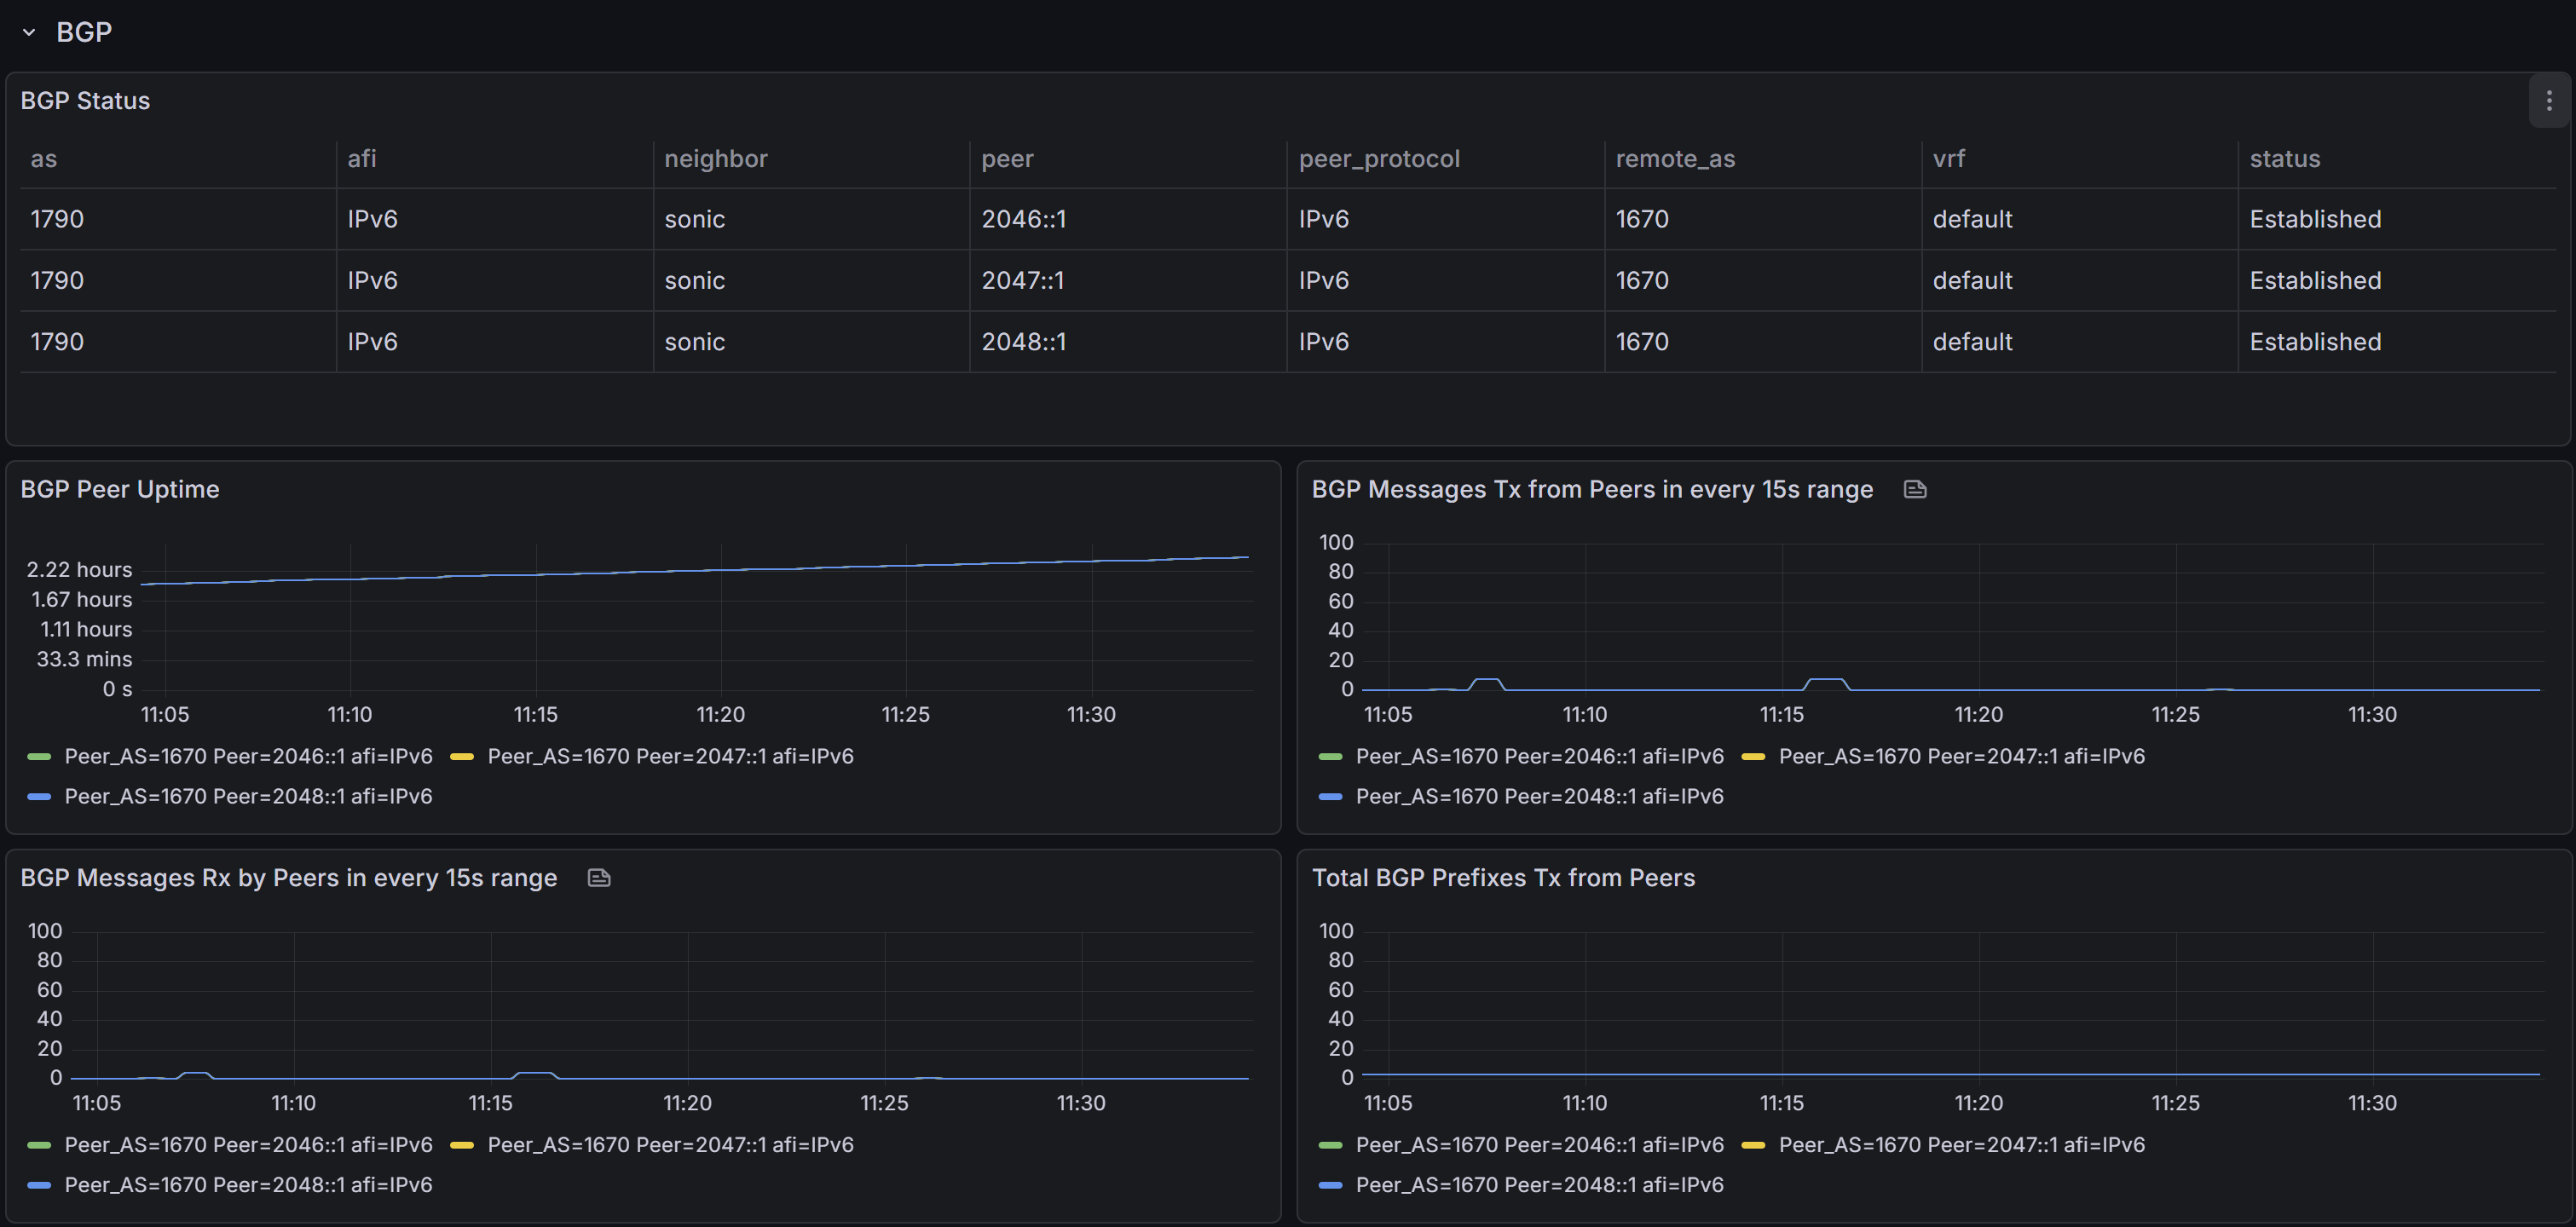
BGP | BGP Status |
BGP Peer Uptime | |
BGP Messages Tx from Peers | |
BGP Messages Rx by Peers | |
Total BGP Prefixes Tx from Peers | |
Total BGP Prefixes Rx by Peers | |
OSPF | OSPF Status |
OSPF Neighbor Uptime | |
OSPF Neighbor Retransmit Counter | |
OSPF Neighbor Request Counter | |
OSPF Neighbor DB Summary Count | |
EVPN | Status of EVPN Endpoints |
Remote VTEPs Operational Status | |
Number of Remote VTEPs Associated with VNI | |
Number of ARPs Cached for the VNI | |
Number of L2 VNIs Associated with an L3 VNI | |
Number of MAC Addresses Learned per VNI | |
SLA | Track Table |
Route Track Table | |
SLA Table | |
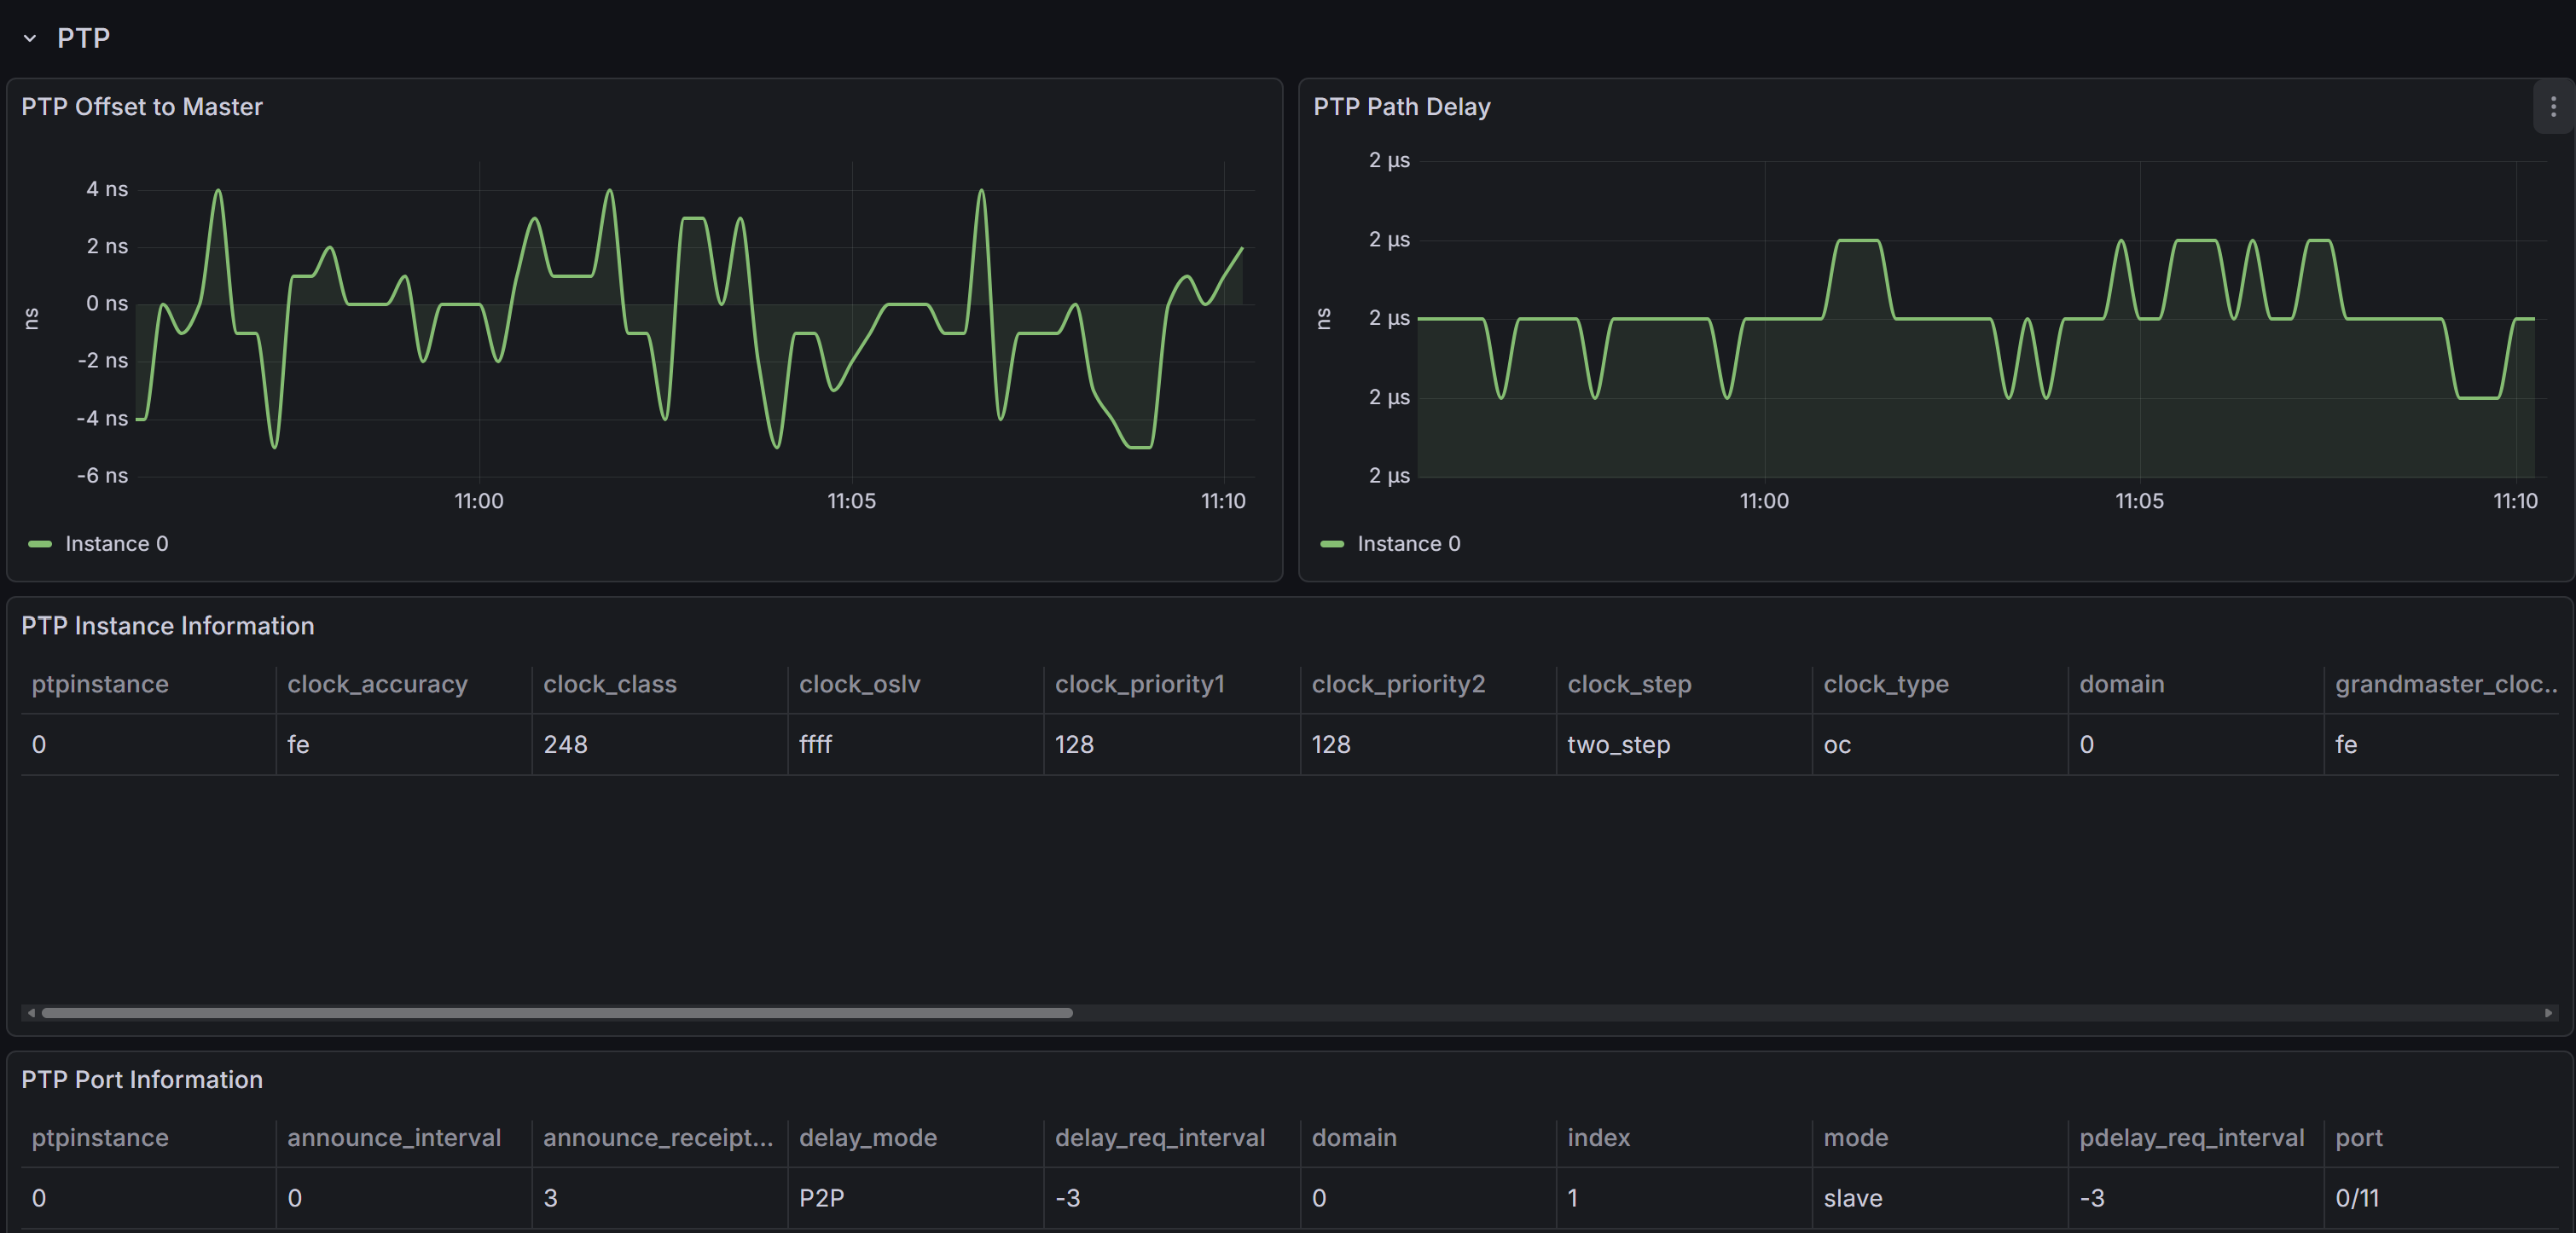
PTP | PTP Offset to Master |
PTP Path Delay | |
PTP Instance Information | |
PTP Port Information | |
PTP sm_tlv Information | |
PTP GNSS Information |
Example Application Scenario
Enterprise campus networks are typically characterized by high-density endpoint access, multi-path redundant business egress, and — in certain scenarios — stringent time-synchronization requirements. Using its direct, local Redis in-memory database connectivity, the Exporter helps users build a unified, closed-loop, multi-service observability solution spanning the physical layer, link layer, routing layer, security-policy layer, and high-precision time-synchronization layer.
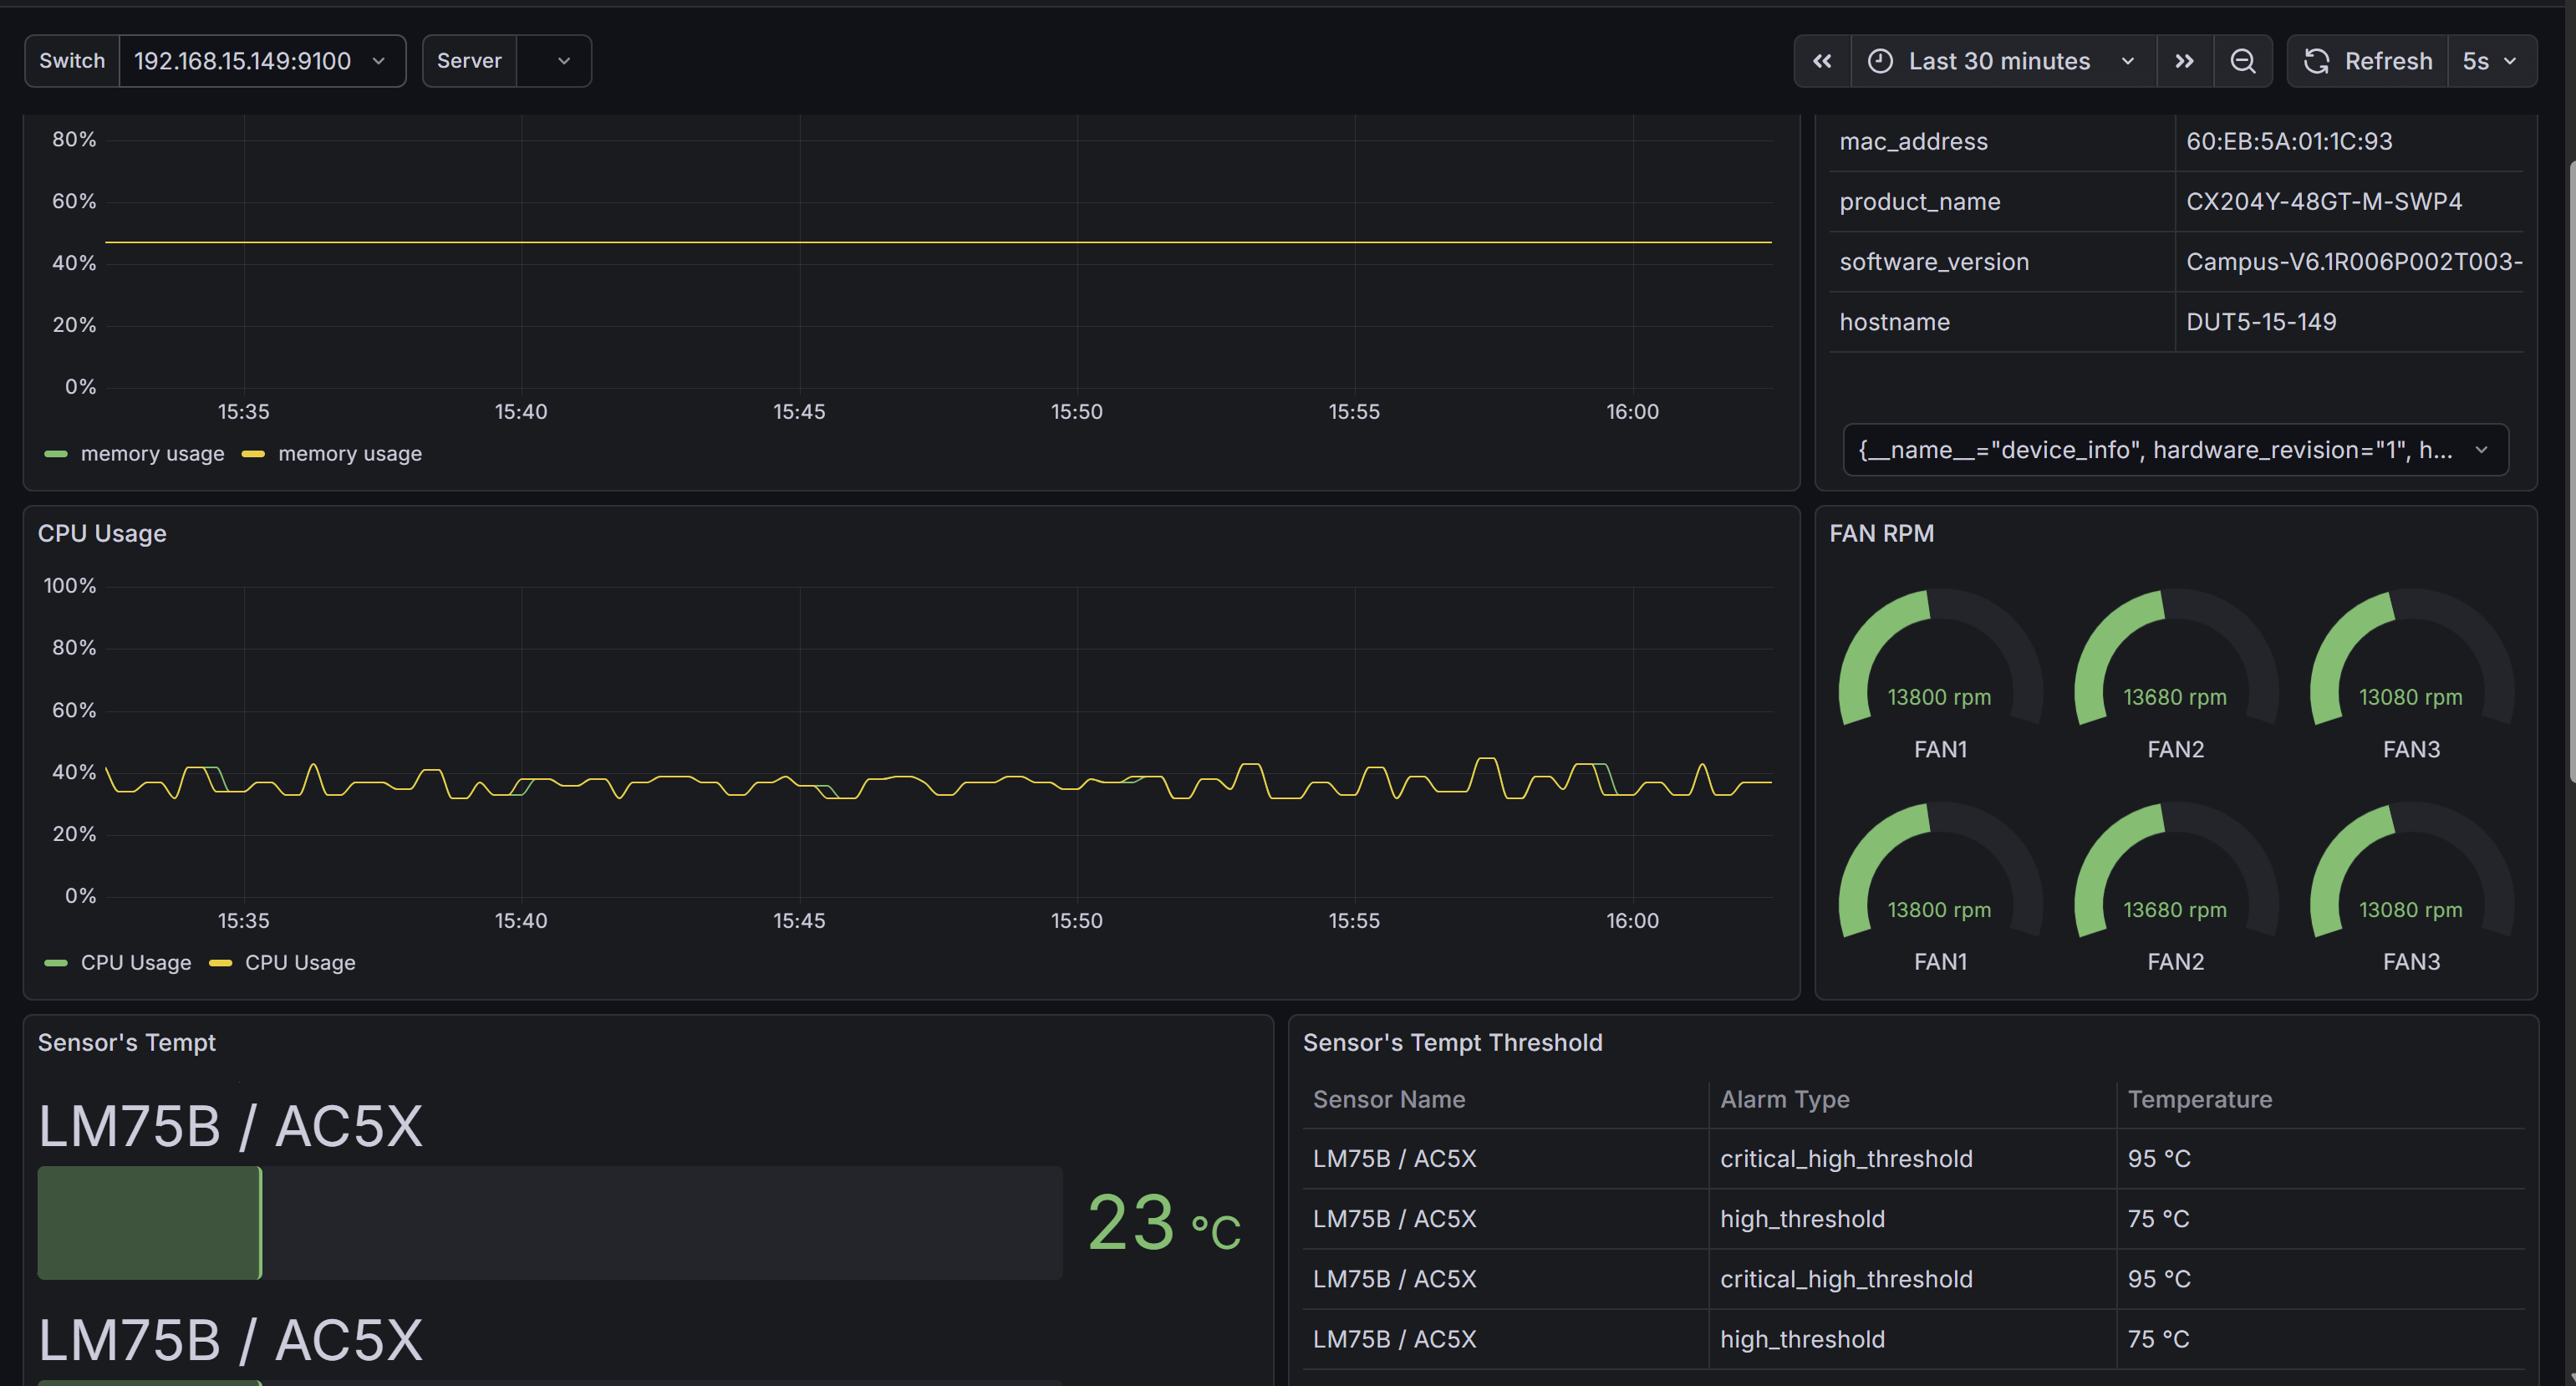
Device status:
Link status:
Protocol operational status: