Simplifying RoCE Deployment for AI Data Centers
As AI workloads scale from hundreds to tens of thousands of GPUs, the underlying network infrastructure must keep pace. RDMA over Converged Ethernet (RoCE) has become the de facto high-performance transport layer for GPU-to-GPU communication in AI data centers — but deploying and operating RoCE correctly has historically been a complex, error-prone, and time-consuming undertaking. Misconfigured PFC thresholds, wrong ECN parameters, or improperly tuned QoS policies can silently degrade training throughput by 30–50%, with no obvious alarm.
EasyRoCE is the answer to this challenge. It is a comprehensive toolkit purpose-built to dramatically simplify every stage of RoCE deployment and operations in AI data center (AIDC) networks — from initial infrastructure planning through day-to-day monitoring and fault isolation. Built on open networking technology and running on AsterNOS, EasyRoCE organizes its capabilities into three pillars: Simple Deployment, Smart Traffic Control, and Efficient O&M.
Pillar 1: Simple Deployment
AID — AI Infrastructure Descriptor
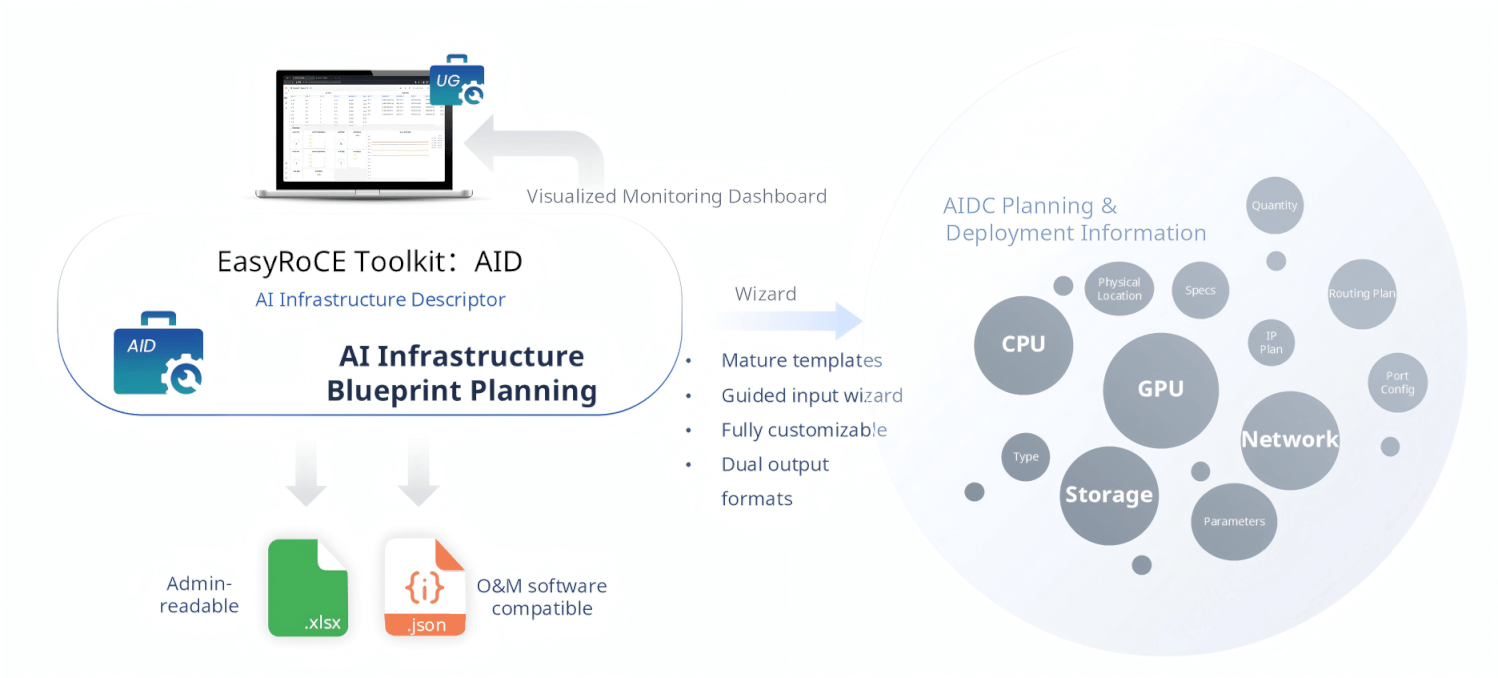
Before a single cable is plugged in, a network operator must answer dozens of questions: How many GPU nodes? What NIC model and interface speed? What’s the IP plan? How is the routing structured? What storage topology is used?
AID (AI Infrastructure Descriptor) is EasyRoCE’s planning wizard. It provides mature, battle-tested document templates that proactively guide operators through capturing all AIDC infrastructure parameters — GPU specifications, CPU configurations, storage layout, network topology, IP planning, routing design, port mapping, transceiver types, and more. The wizard ensures nothing is missed.
AID outputs two formats: .xlsx for human-readable review by network administrators, and .json for direct consumption by O&M automation software. These structured planning artifacts then serve as the shared data source for every other tool in the EasyRoCE Toolkit, enabling automation downstream. The results are also surfaced in a visualized monitoring dashboard through the Unified Glancer (UG).
ORD — One-Click RoCE Deployment
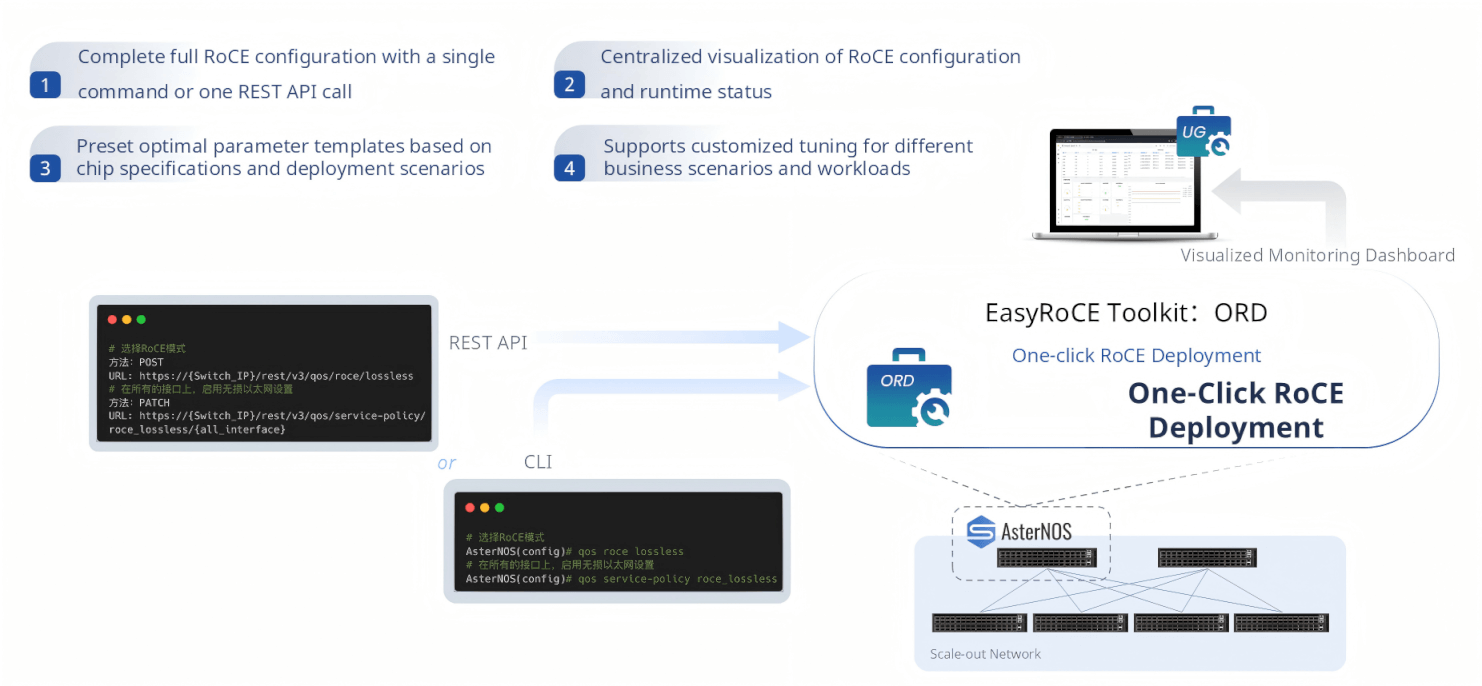
With planning data in hand, ORD (One-click RoCE Deployment) handles the actual configuration push. What once required manually crafting and applying dozens of switch commands — setting PFC priorities, configuring ECN thresholds, applying QoS service policies, enabling RoCE on every interface — is reduced to a single operation.
Operators can trigger ORD via a single CLI command or a single RESTful API call. ORD handles the rest: it selects the appropriate pre-built parameter template based on the chip specifications and deployment scenario, applies the configuration across all target ports, and confirms the result. For organizations building automation pipelines, the REST API interface enables seamless integration with Ansible, Kubernetes operators, or custom orchestration systems. The runtime configuration and operational status are immediately visible in the UG dashboard.
RPA — RoCE Parameter Automation
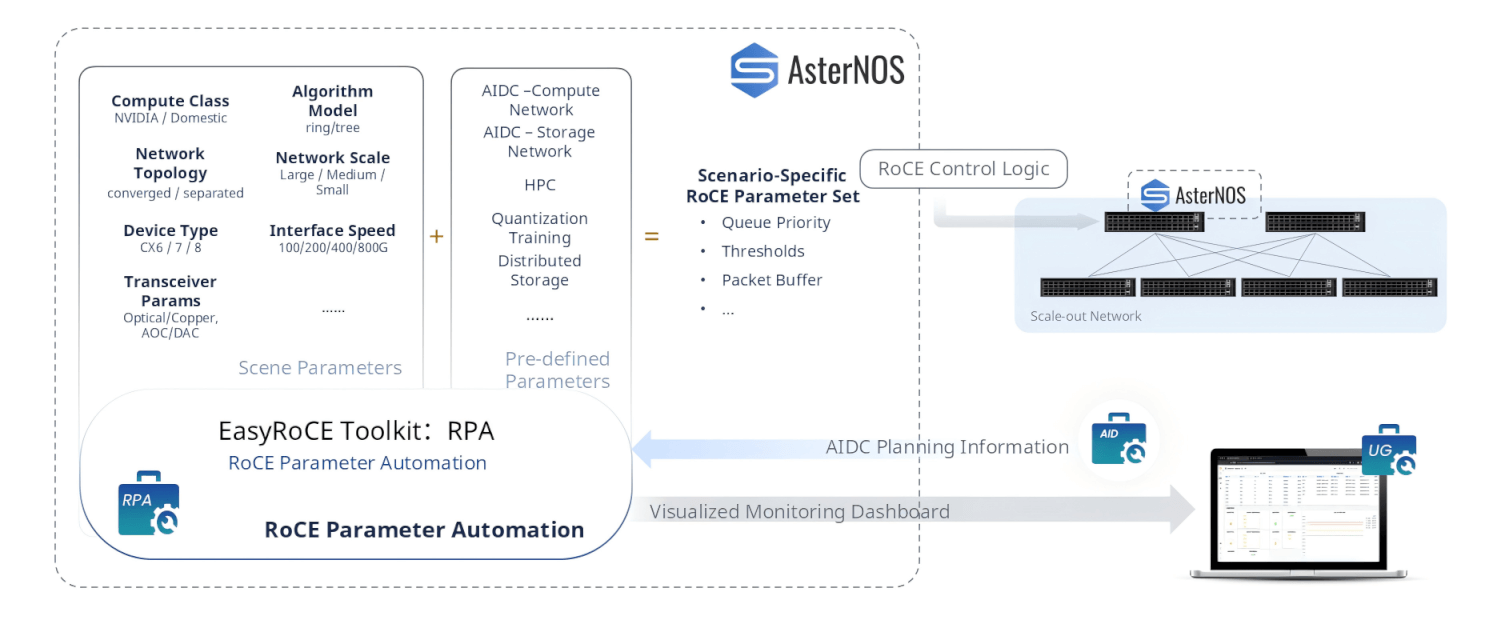
RoCE is not one-size-fits-all. A large-scale NVIDIA GPU cluster running all-reduce ring-based training has very different optimal RoCE parameters compared to an HPC cluster, a distributed storage network, or a quantization inference farm.
RPA (RoCE Parameter Automation) solves this by automatically generating scenario-specific RoCE parameter sets. It takes two inputs: the AIDC planning information from AID (compute class, network topology, device type, interface speed, transceiver characteristics) and a pre-defined multi-scenario template library covering AIDC compute networks, AIDC storage networks, HPC, quantization algorithm training, distributed storage, and more. From these inputs, RPA produces a complete, scenario-calibrated parameter set — queue priorities, ECN/DCQCN thresholds, packet buffer allocations, PFC configurations — and pushes it directly to AsterNOS switches via the RoCE control logic. No manual parameter research required.
Pillar 2: Smart Traffic Control
Once the network is live, EasyRoCE’s Smart Traffic Control tools ensure that AI training traffic flows exactly as intended — with correctly mapped routes, isolated tenants, and proactive path control.
IRM — In-Node Route Map
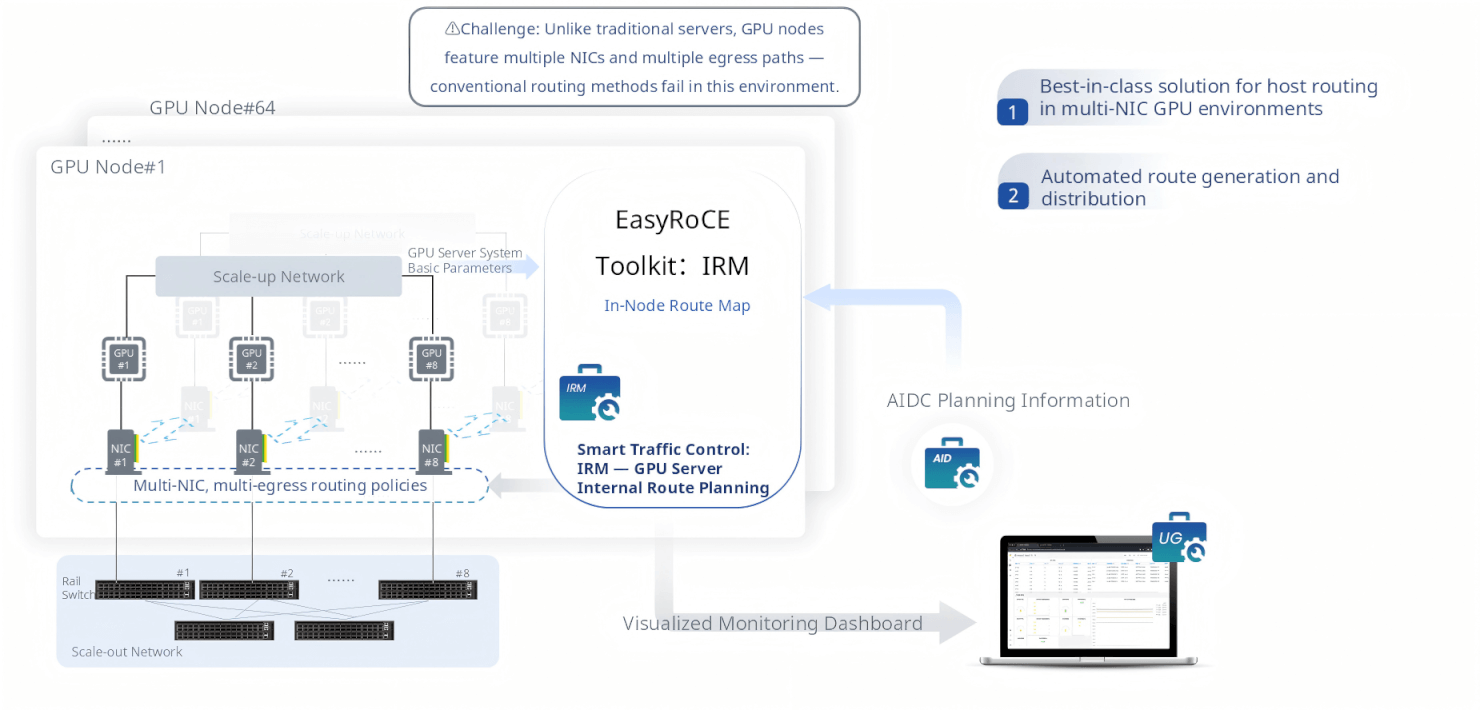
A traditional server has one NIC and a simple default route. A modern GPU server has 8 NICs, each connected to a different Top-of-Rack switch rail, each belonging to a different subnet. Standard Linux routing mechanisms break down entirely in this environment: traffic from GPU #3 may exit through NIC #1 instead of NIC #3, causing asymmetric flows, ECMP imbalances, and degraded training performance.
IRM (In-Node Route Map) is EasyRoCE’s solution to the host routing problem in multi-NIC GPU server environments. It automatically generates the correct per-NIC policy routing rules and distributes them to every GPU server in the cluster, ensuring that each GPU’s traffic exits through its paired NIC and reaches the correct Rail switch. IRM draws from AID’s AIDC planning data to understand the NIC-to-GPU-to-switch topology and automates what would otherwise require painstaking manual configuration on every node.
EPS — E2E Path Scheduler
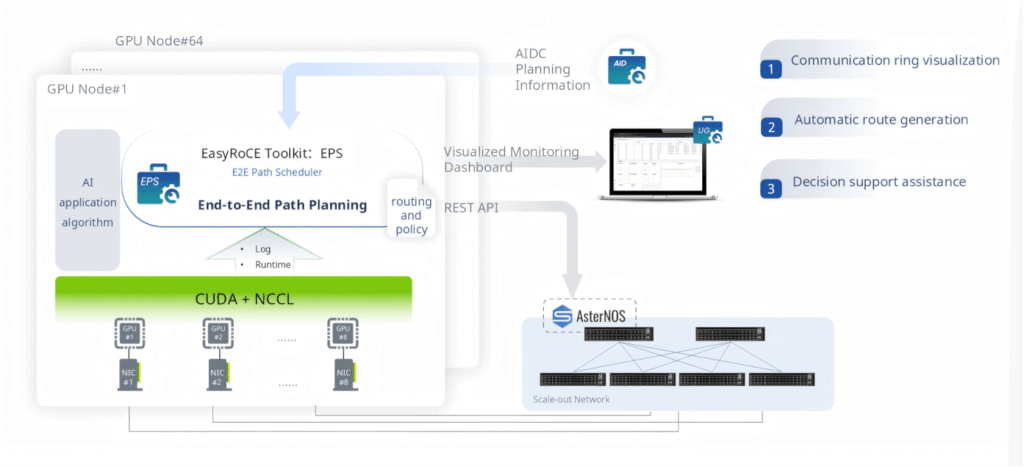
For AI collective communication operations (AllReduce, AllGather, ReduceScatter), the communication pattern — the “ring” or “tree” — must be correctly mapped onto the physical network topology to achieve optimal bandwidth utilization. If NCCL’s communication ring is misaligned with the switch topology, cross-rail traffic surges on certain links while others sit idle.
EPS (End-to-End Path Scheduler) analyzes AI application algorithm logs and NCCL runtime telemetry to understand the communication pattern, then automatically generates optimized routing and policy configurations that align the communication ring with the physical network. EPS visualizes these rings in the UG dashboard, giving operators clear insight into how collective operations traverse the network, and exposes a REST API for integration with external AI framework orchestrators.
PPD — Proactive Path Definer
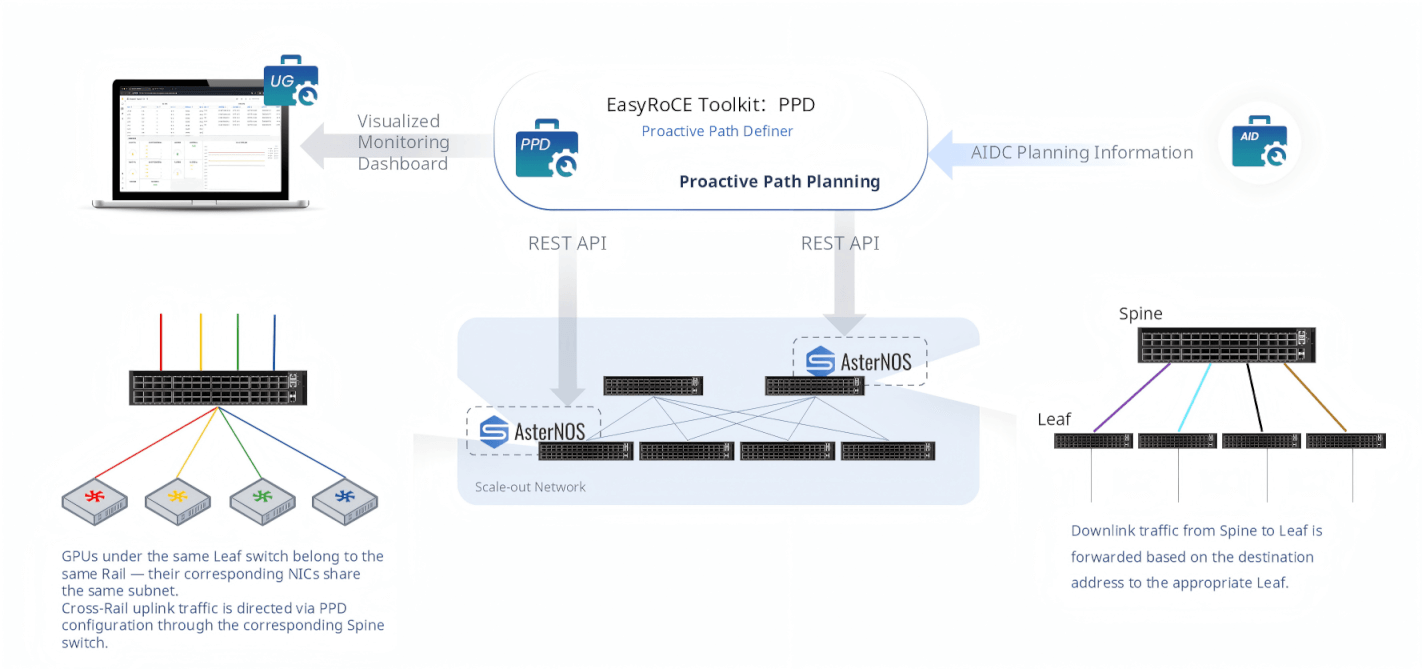
In a Rail-optimized Spine-Leaf fabric, traffic flows follow specific rules: GPUs under the same Leaf switch share a Rail and communicate within the same subnet without hitting the Spine. Cross-Rail traffic ascends through the Spine layer, and downlink traffic is forwarded based on destination address back to the appropriate Leaf.
PPD (Proactive Path Definer) codifies these rules into explicit, proactively configured forwarding policies pushed to AsterNOS switches via REST API. Rather than relying solely on dynamic routing to figure it out, PPD ensures that uplink and downlink traffic takes the intended paths from day one — eliminating subtle topology-mismatched forwarding behaviors that degrade training performance and are notoriously difficult to diagnose.
MVD — Multi-Tenant VPC Deployer
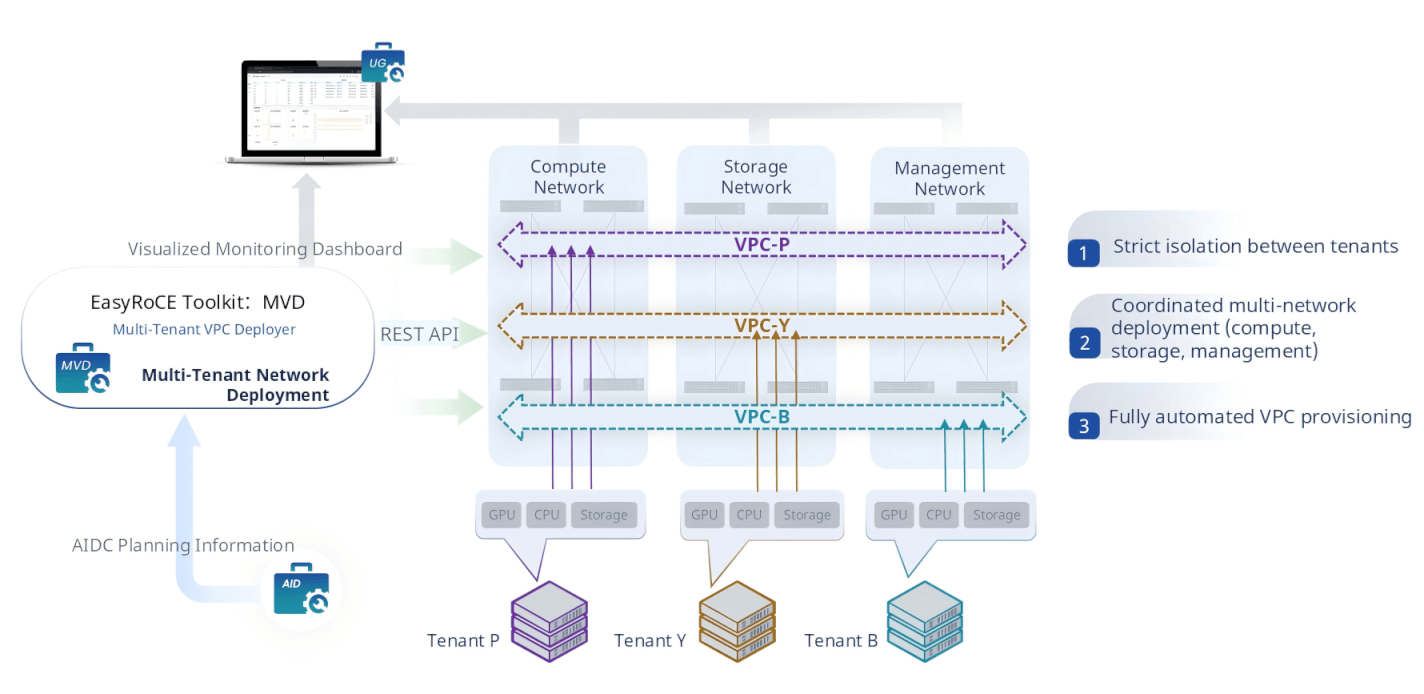
AI data centers are increasingly multi-tenant environments where different teams or customers share the same physical infrastructure. Each tenant’s GPU cluster, CPU nodes, and storage systems must be logically isolated — compute traffic, storage traffic, and management traffic from Tenant A must never be visible to Tenant B.
MVD (Multi-Tenant VPC Deployer) automates the full lifecycle of multi-tenant virtual private cloud (VPC) provisioning across AIDC networks. It automatically generates and enforces VPC isolation and protection policies, coordinates the simultaneous deployment of VPCs across compute, storage, and management networks, and pushes the full configuration to AsterNOS switches via REST API. What previously required manually crafting VLAN, VRF, and ACL configurations across dozens of switches can be accomplished in minutes.
RTR — Real-time Traffic Reporter
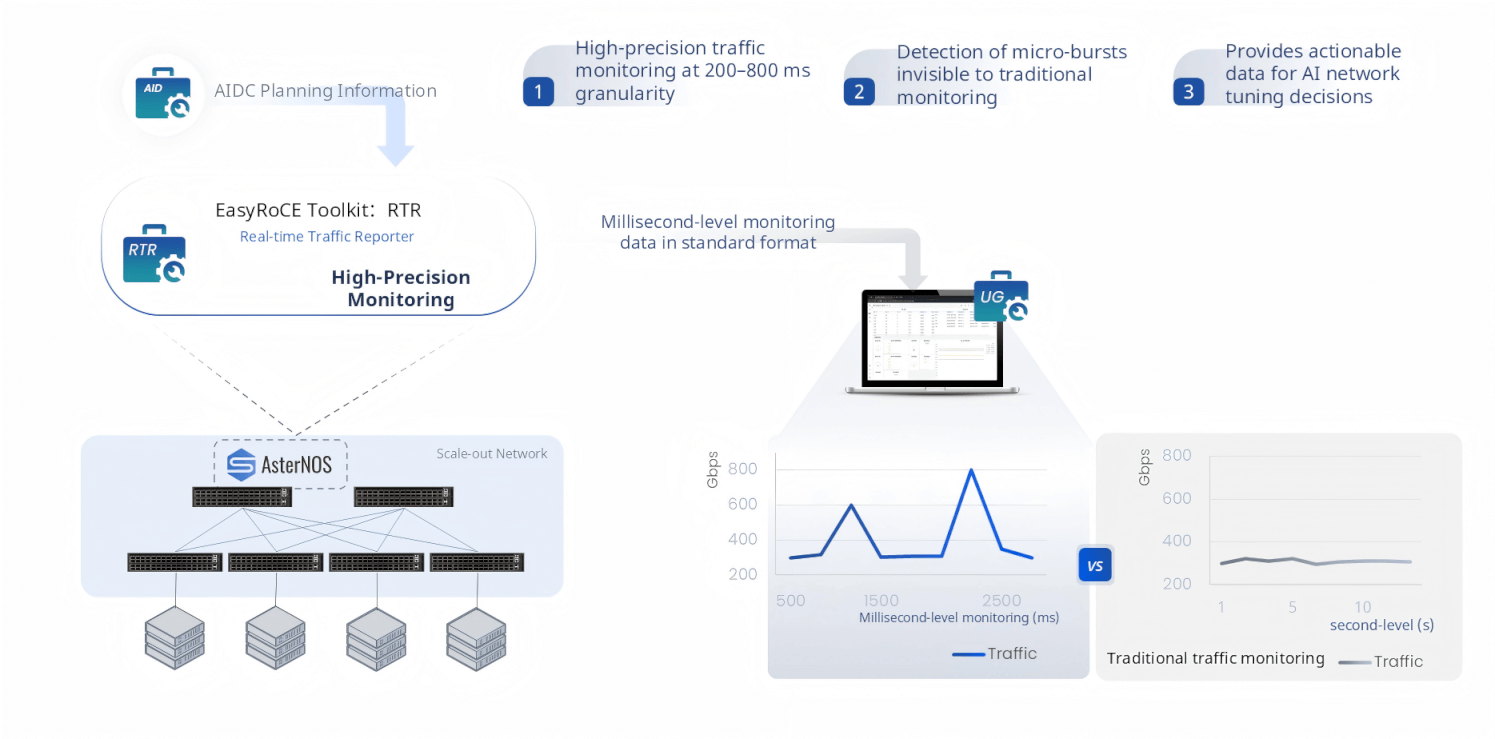
Traditional network monitoring operates at second-level granularity — polling counters every 1 to 10 seconds. For AI training networks, this is woefully insufficient. GPU collective communication produces intense traffic bursts that saturate links for 50–500 milliseconds, then subside. At second-level resolution, these micro-bursts are completely invisible, appearing only as a slightly elevated average — while in reality they were causing buffer overflow, PFC pause storms, and training stalls.
RTR (Real-time Traffic Reporter) captures traffic at 200–800 millisecond granularity, making micro-bursts visible for the first time. It outputs millisecond-level monitoring data in standard Prometheus-compatible format, feeding directly into the UG dashboard for visualization. When something is wrong with training throughput, RTR provides the high-resolution traffic data needed to understand whether it’s a sustained congestion issue or a transient burst problem — critical context for making the right tuning decision.
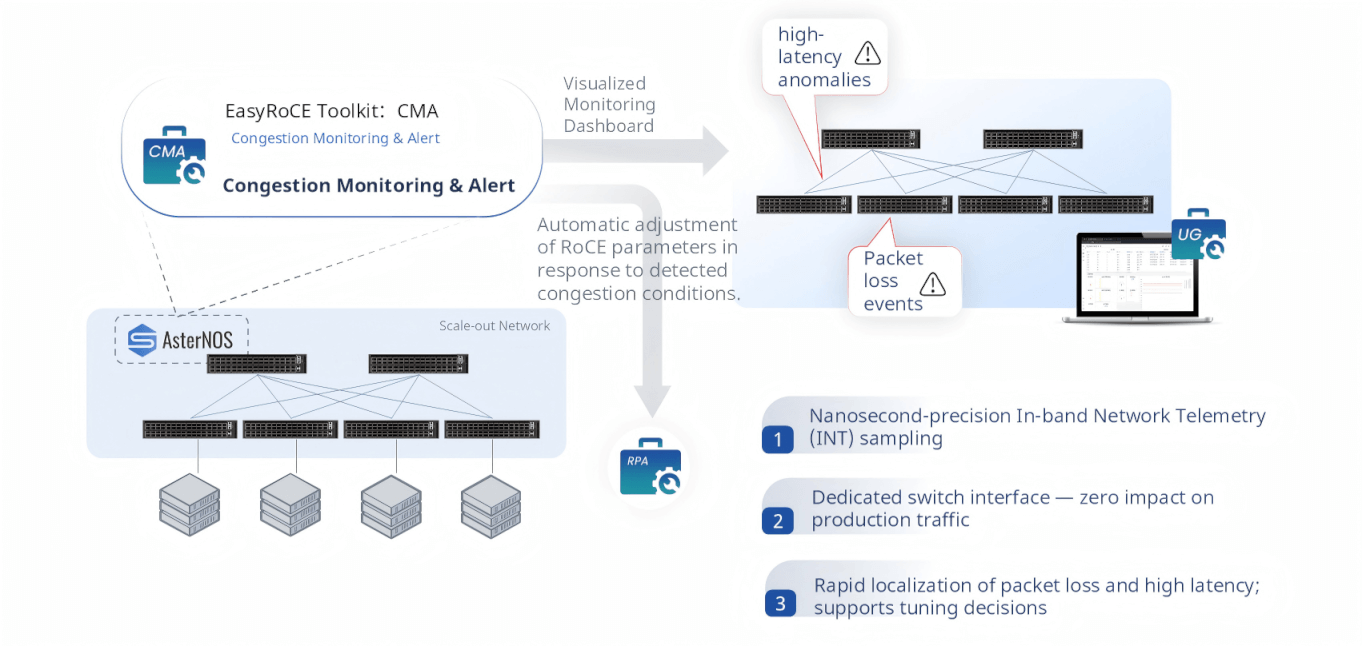
CMA — Congestion Monitoring & Alert
CMA (Congestion Monitoring & Alert) delivers nanosecond-precision visibility into congestion events using In-band Network Telemetry (INT). By leveraging dedicated hardware telemetry interfaces on AsterNOS switches — completely separate from the production forwarding path — CMA collects INT data without consuming any production bandwidth or introducing any additional latency to live AI training traffic.
When packet loss or high latency is detected, CMA raises an alert and pinpoints the exact location in the network where congestion occurred. Beyond alerting, CMA closes the operational loop by feeding congestion intelligence directly into RPA, enabling automatic recalibration of RoCE parameters in response to observed network conditions.
Pillar 3: Efficient O&M
A well-deployed network still requires continuous monitoring, fault isolation, and day-to-day operational visibility. EasyRoCE’s O&M toolkit provides a rich set of purpose-built observability tools, all integrated into a unified dashboard.
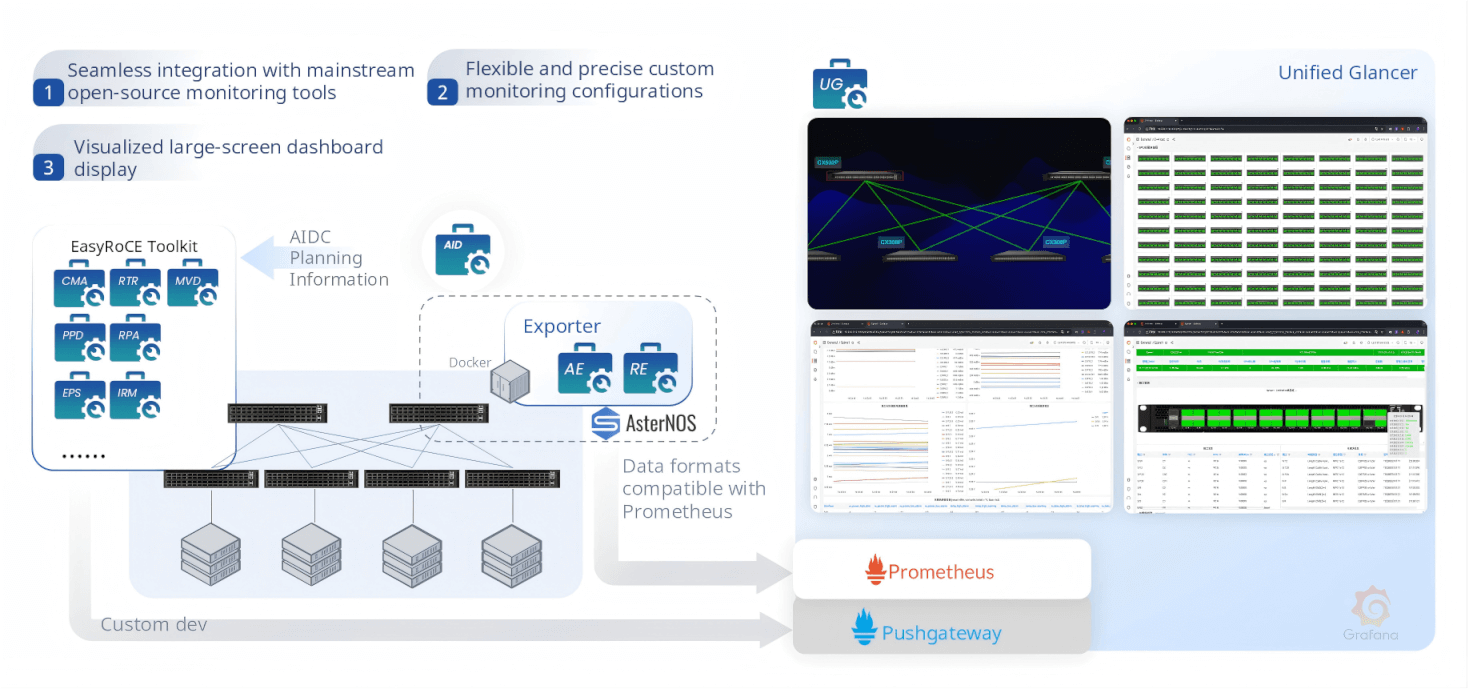
UG — Unified Glancer
UG (Unified Glancer) is the centralized monitoring hub of the EasyRoCE Toolkit. All sub-tools export their telemetry via Prometheus-compatible Exporters (AE and RE), which run as lightweight Docker containers alongside AsterNOS. Data flows into Prometheus and Pushgateway, and is rendered in fully customizable Grafana dashboards. UG provides a single pane of glass across the entire AIDC network — switch status, RoCE parameters, traffic, topology, transceivers, links, and RDMA sessions — with support for secondary development and custom integrations.
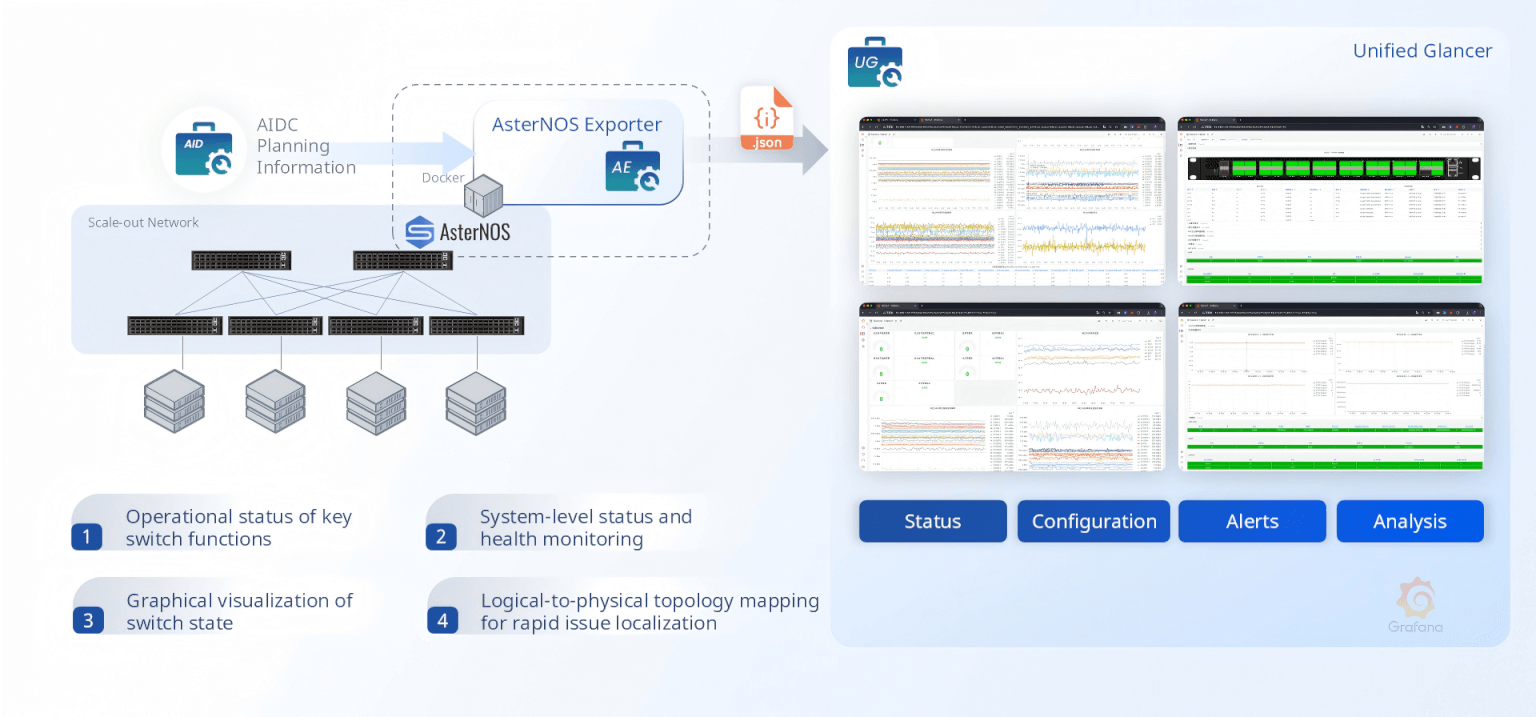
AE & RE — AsterNOS Exporter and RoCE Exporter
AE (AsterNOS Exporter) exports comprehensive switch operational metrics: interface status, system health, configuration state, traffic counters, and anomaly alerts — all in Prometheus-compatible JSON format. It maps logical constructs to physical topology, enabling operators to navigate from a routing domain down to a physical port in seconds.
RE (RoCE Exporter) provides dedicated RoCE protocol telemetry: PFC configurations, ECN/DCQCN operational parameters, per-queue RoCE traffic counters, pause frame statistics, and congestion indicators. It gives operators an at-a-glance view of RoCE health across every switch in the fabric.
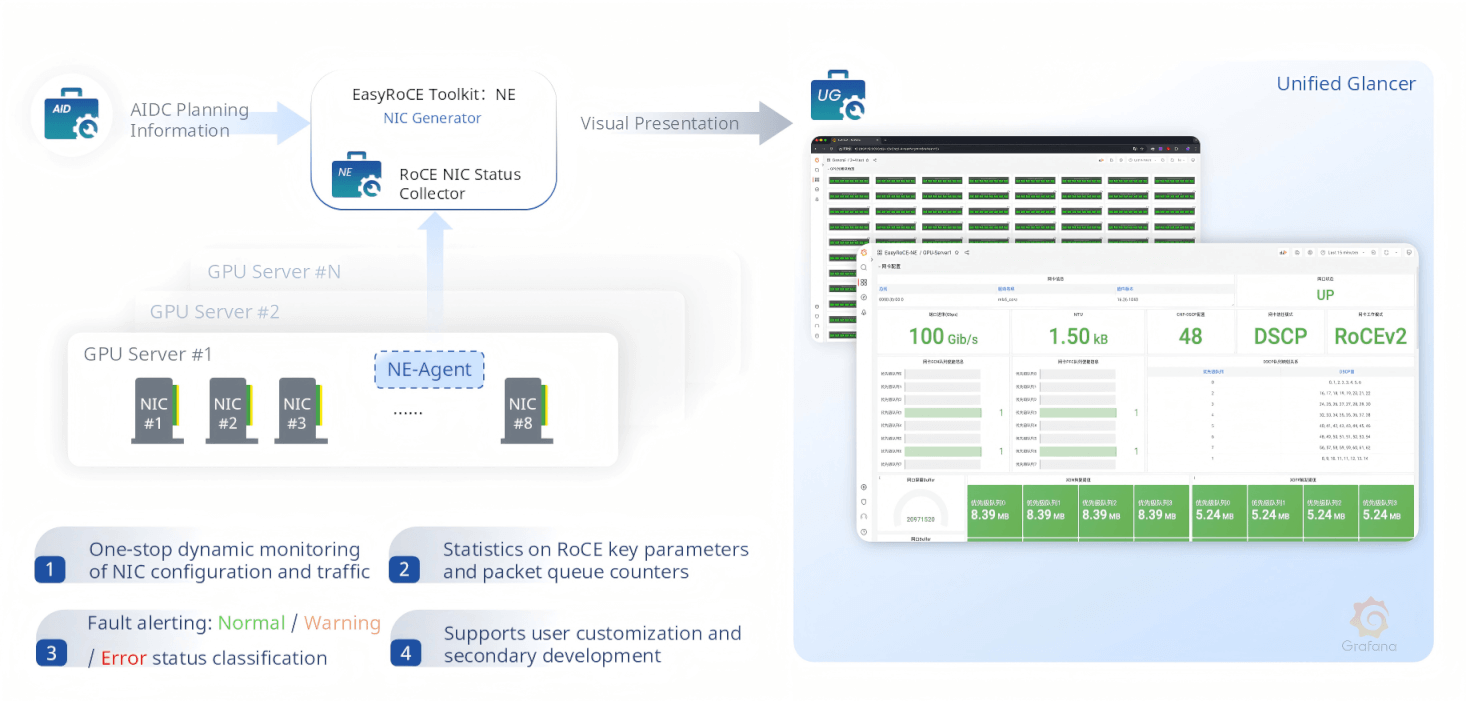
NE — NIC Exporter
NE (NIC Exporter) deploys a lightweight NE-Agent on each GPU server, continuously collecting NIC configuration and traffic status from all 8 NICs per node. It monitors RoCE key parameters (MTU, DSCP markings, RoCE version), per-queue packet statistics, link operational state, and raises three-tier fault alerts — Normal, Warning, and Fault — surfaced in the UG dashboard.
TG, TM, LM, DP — Topology, Transceivers, Links, and Device Panels
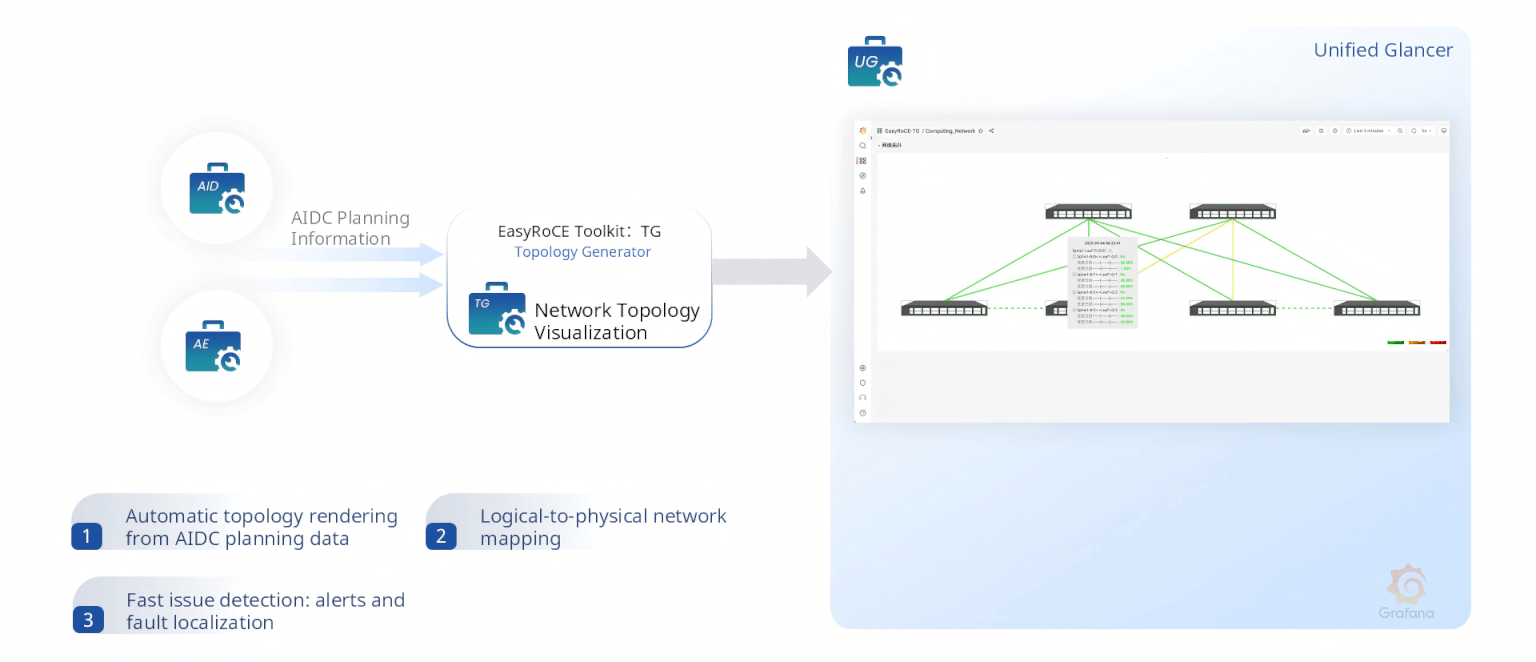
TG (Topology Generator) automatically renders a live, interactive network topology by combining AIDC planning data with real-time switch telemetry. It maps logical constructs to physical devices and ports, with color-coded health indicators that enable instant fault localization.
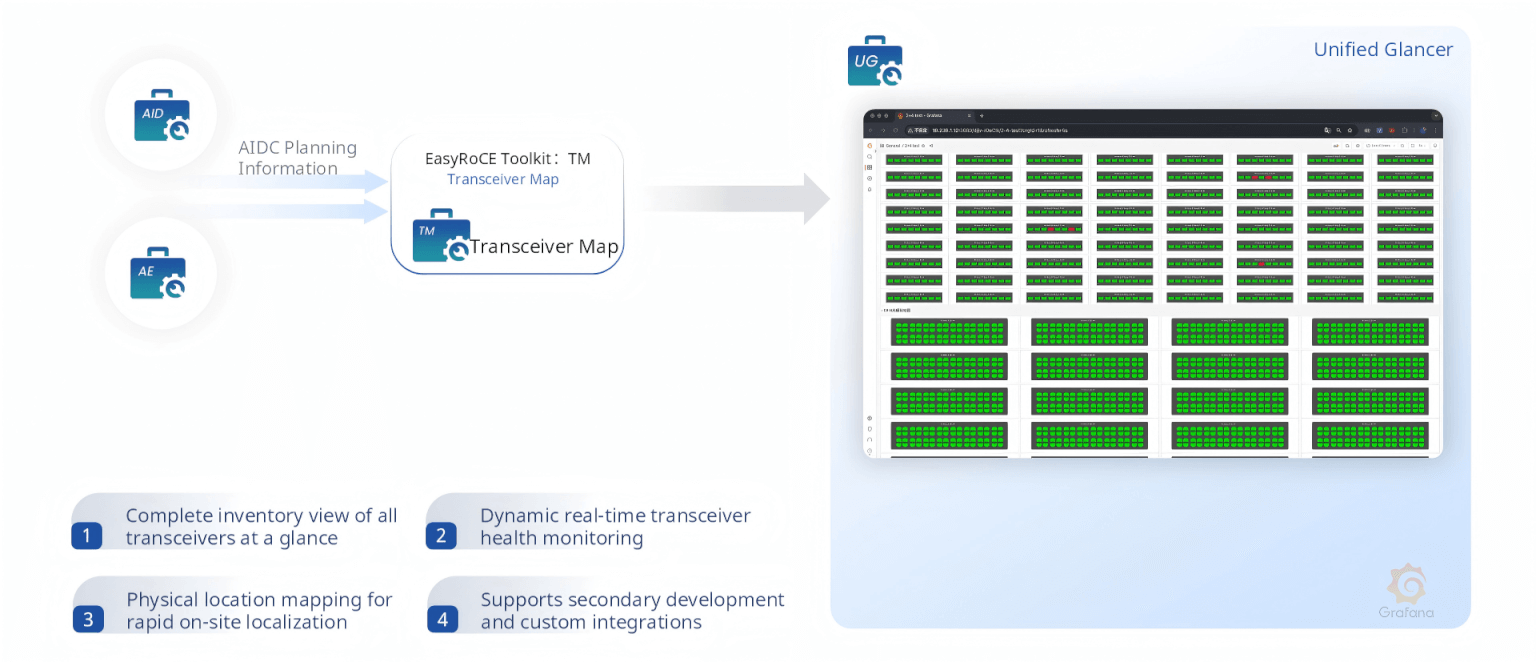
TM (Transceiver Map) displays every optical transceiver across the entire fabric in a structured grid, providing real-time monitoring of Tx/Rx power, temperature, voltage, and bias current. Physical position mapping means on-site maintenance teams can immediately locate a failing module.
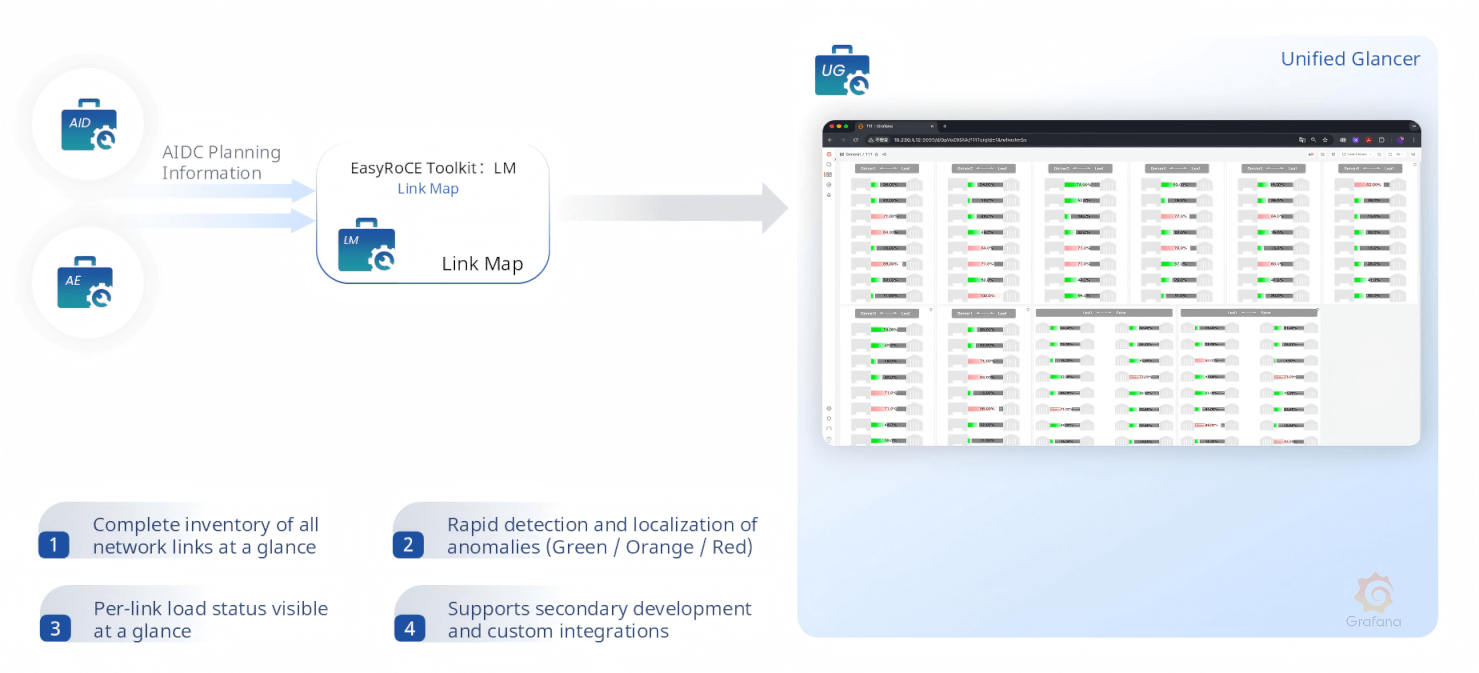
LM (Link Map) gives a complete view of every network link and its real-time load status, using green/orange/red indicators to highlight overloaded, degraded, or failed links at a glance.
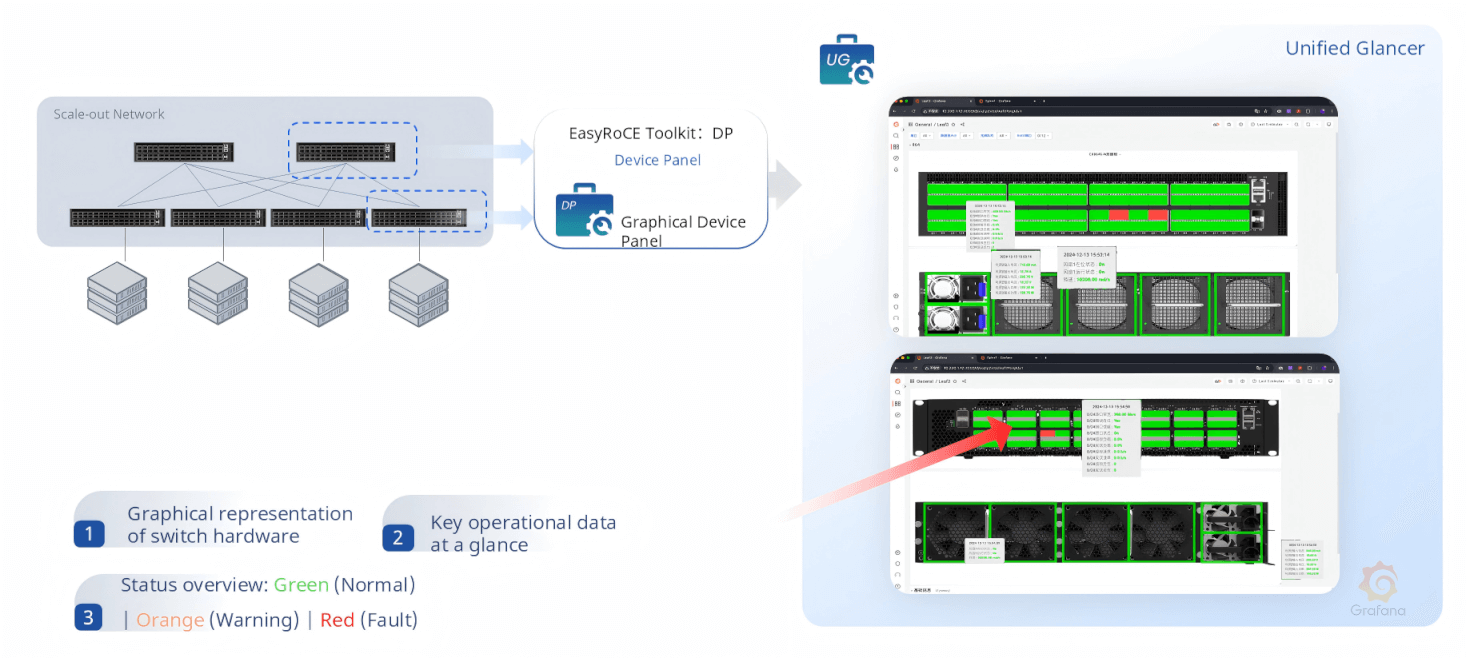
DP (Device Panel) renders a photorealistic graphical representation of each AsterNOS switch’s physical panel, with per-port status indicators, on-hover statistics, and fan/power supply health — providing situational awareness that static CLI output simply cannot match.
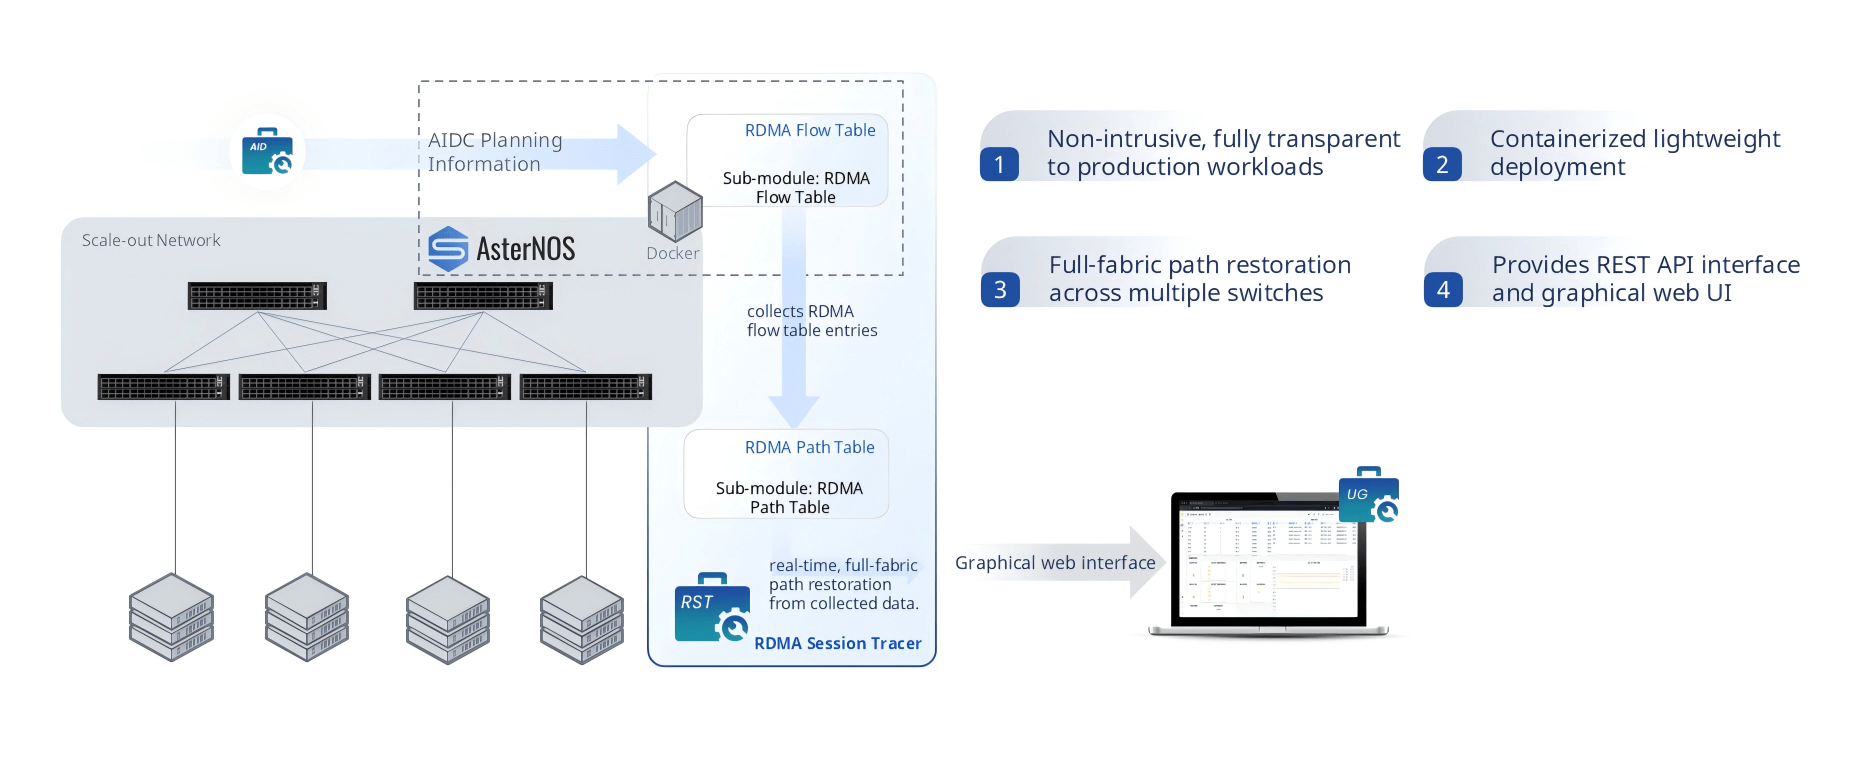
RST — RDMA Session Tracer
When an RDMA flow is misbehaving — taking a suboptimal path, experiencing unexplained latency, or simply not appearing where it should — RST (RDMA Session Tracer) provides the answer. It collects RDMA flow table entries from every AsterNOS switch in the fabric, reconstructs complete end-to-end RDMA session paths across multiple hops, and displays them in a graphical web interface.
Crucially, RST is fully non-intrusive: it requires zero modification to GPU servers, NIC drivers, or RDMA applications. It deploys as a Docker container, exposes a REST API for programmatic path queries, and requires no agents on compute nodes. For complex RDMA debugging scenarios that would otherwise require hours of packet captures and log correlation, RST reduces resolution time to minutes.
Designed for the AI Networking Era
EasyRoCE is built on a philosophy that AI infrastructure operators should not need to be RoCE parameter experts to run a high-performance AI network. By combining automated planning (AID), one-click deployment (ORD), scenario-aware parameter generation (RPA), intelligent path control (IRM, EPS, PPD, MVD), high-resolution monitoring (RTR, CMA), and rich O&M tooling (UG, AE, RE, NE, TG, TM, LM, DP, RST) into a cohesive, open-networking-based toolkit, EasyRoCE makes production-grade RoCE accessible — whether you are bringing up your first GPU cluster or scaling to thousands of nodes.
All tools support secondary development and integration via REST APIs and Prometheus-compatible data formats, ensuring EasyRoCE fits naturally into existing DevOps and MLOps automation pipelines rather than requiring a rip-and-replace of existing tooling.
For teams building or operating AI data centers on AsterNOS, EasyRoCE represents a fundamentally simpler path from hardware installation to a fully operational, optimally tuned, and continuously monitored RoCE network.